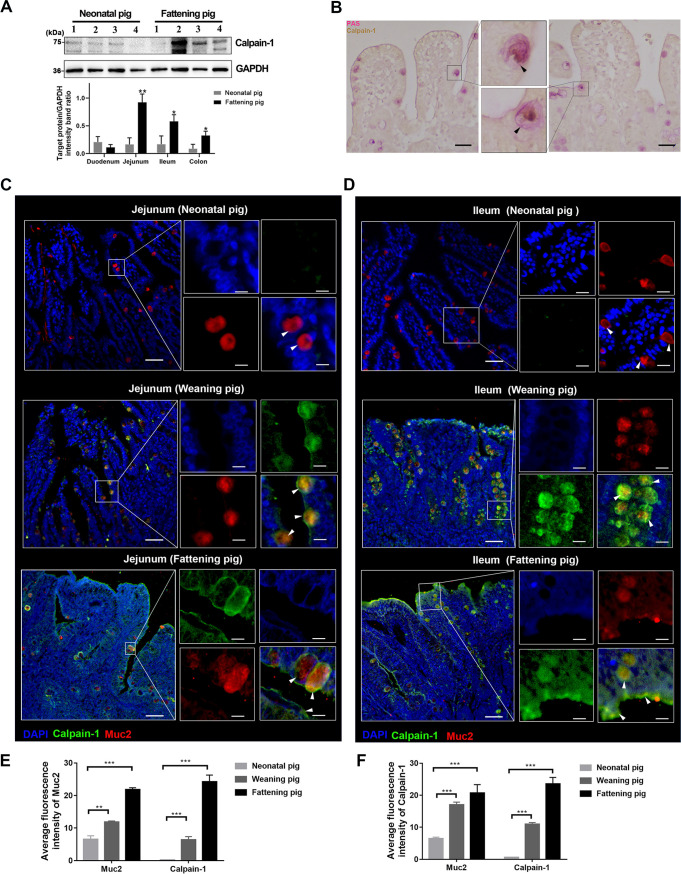
FIG 6.
Distribution of calpain-1 in the intestines of newborn and weaned piglets. (A) Protein expression levels of calpain-1 in different intestinal segments of newborn and weaned piglets, as quantified via Western blot analysis. “1” indicates duodenum, “2” indicates jejunum, “3” indicates ileum, and “4” indicates colon. Calpain-1 expression presented in a bar chart. (B) Distribution of calpain-1 in the jejunum of weaned piglets. Calpain-1 is indicated by yellow-brown staining and marked with black arrows. (C, D) Distribution of calpain-1 in the jejunum (C) and ileum (D) of neonatal piglet, weaned piglet, and finisher pig. The nuclei were stained with DAPI (blue). Bar = 50 μm. White arrows indicate calpain-1 in the mucus layer and goblet cells. Bar = 10 μm. (E, F) Statistical results of muc2 and calpain-1 fluorescence intensity in jejunum (E) and ileum (F) of neonatal piglet, weaned piglet, and finisher pig. The ImageJ software was used for quantification of mean fluorescence intensity. The data are presented as means ± SD from three independent experiments. *, P < 0.05; **; P < 0.01; ***, P < 0.001. DAPI, 4′,6-diamidino-2-phenylindole; PAS, periodic acid-Schiff; Muc2, mucin 2.

