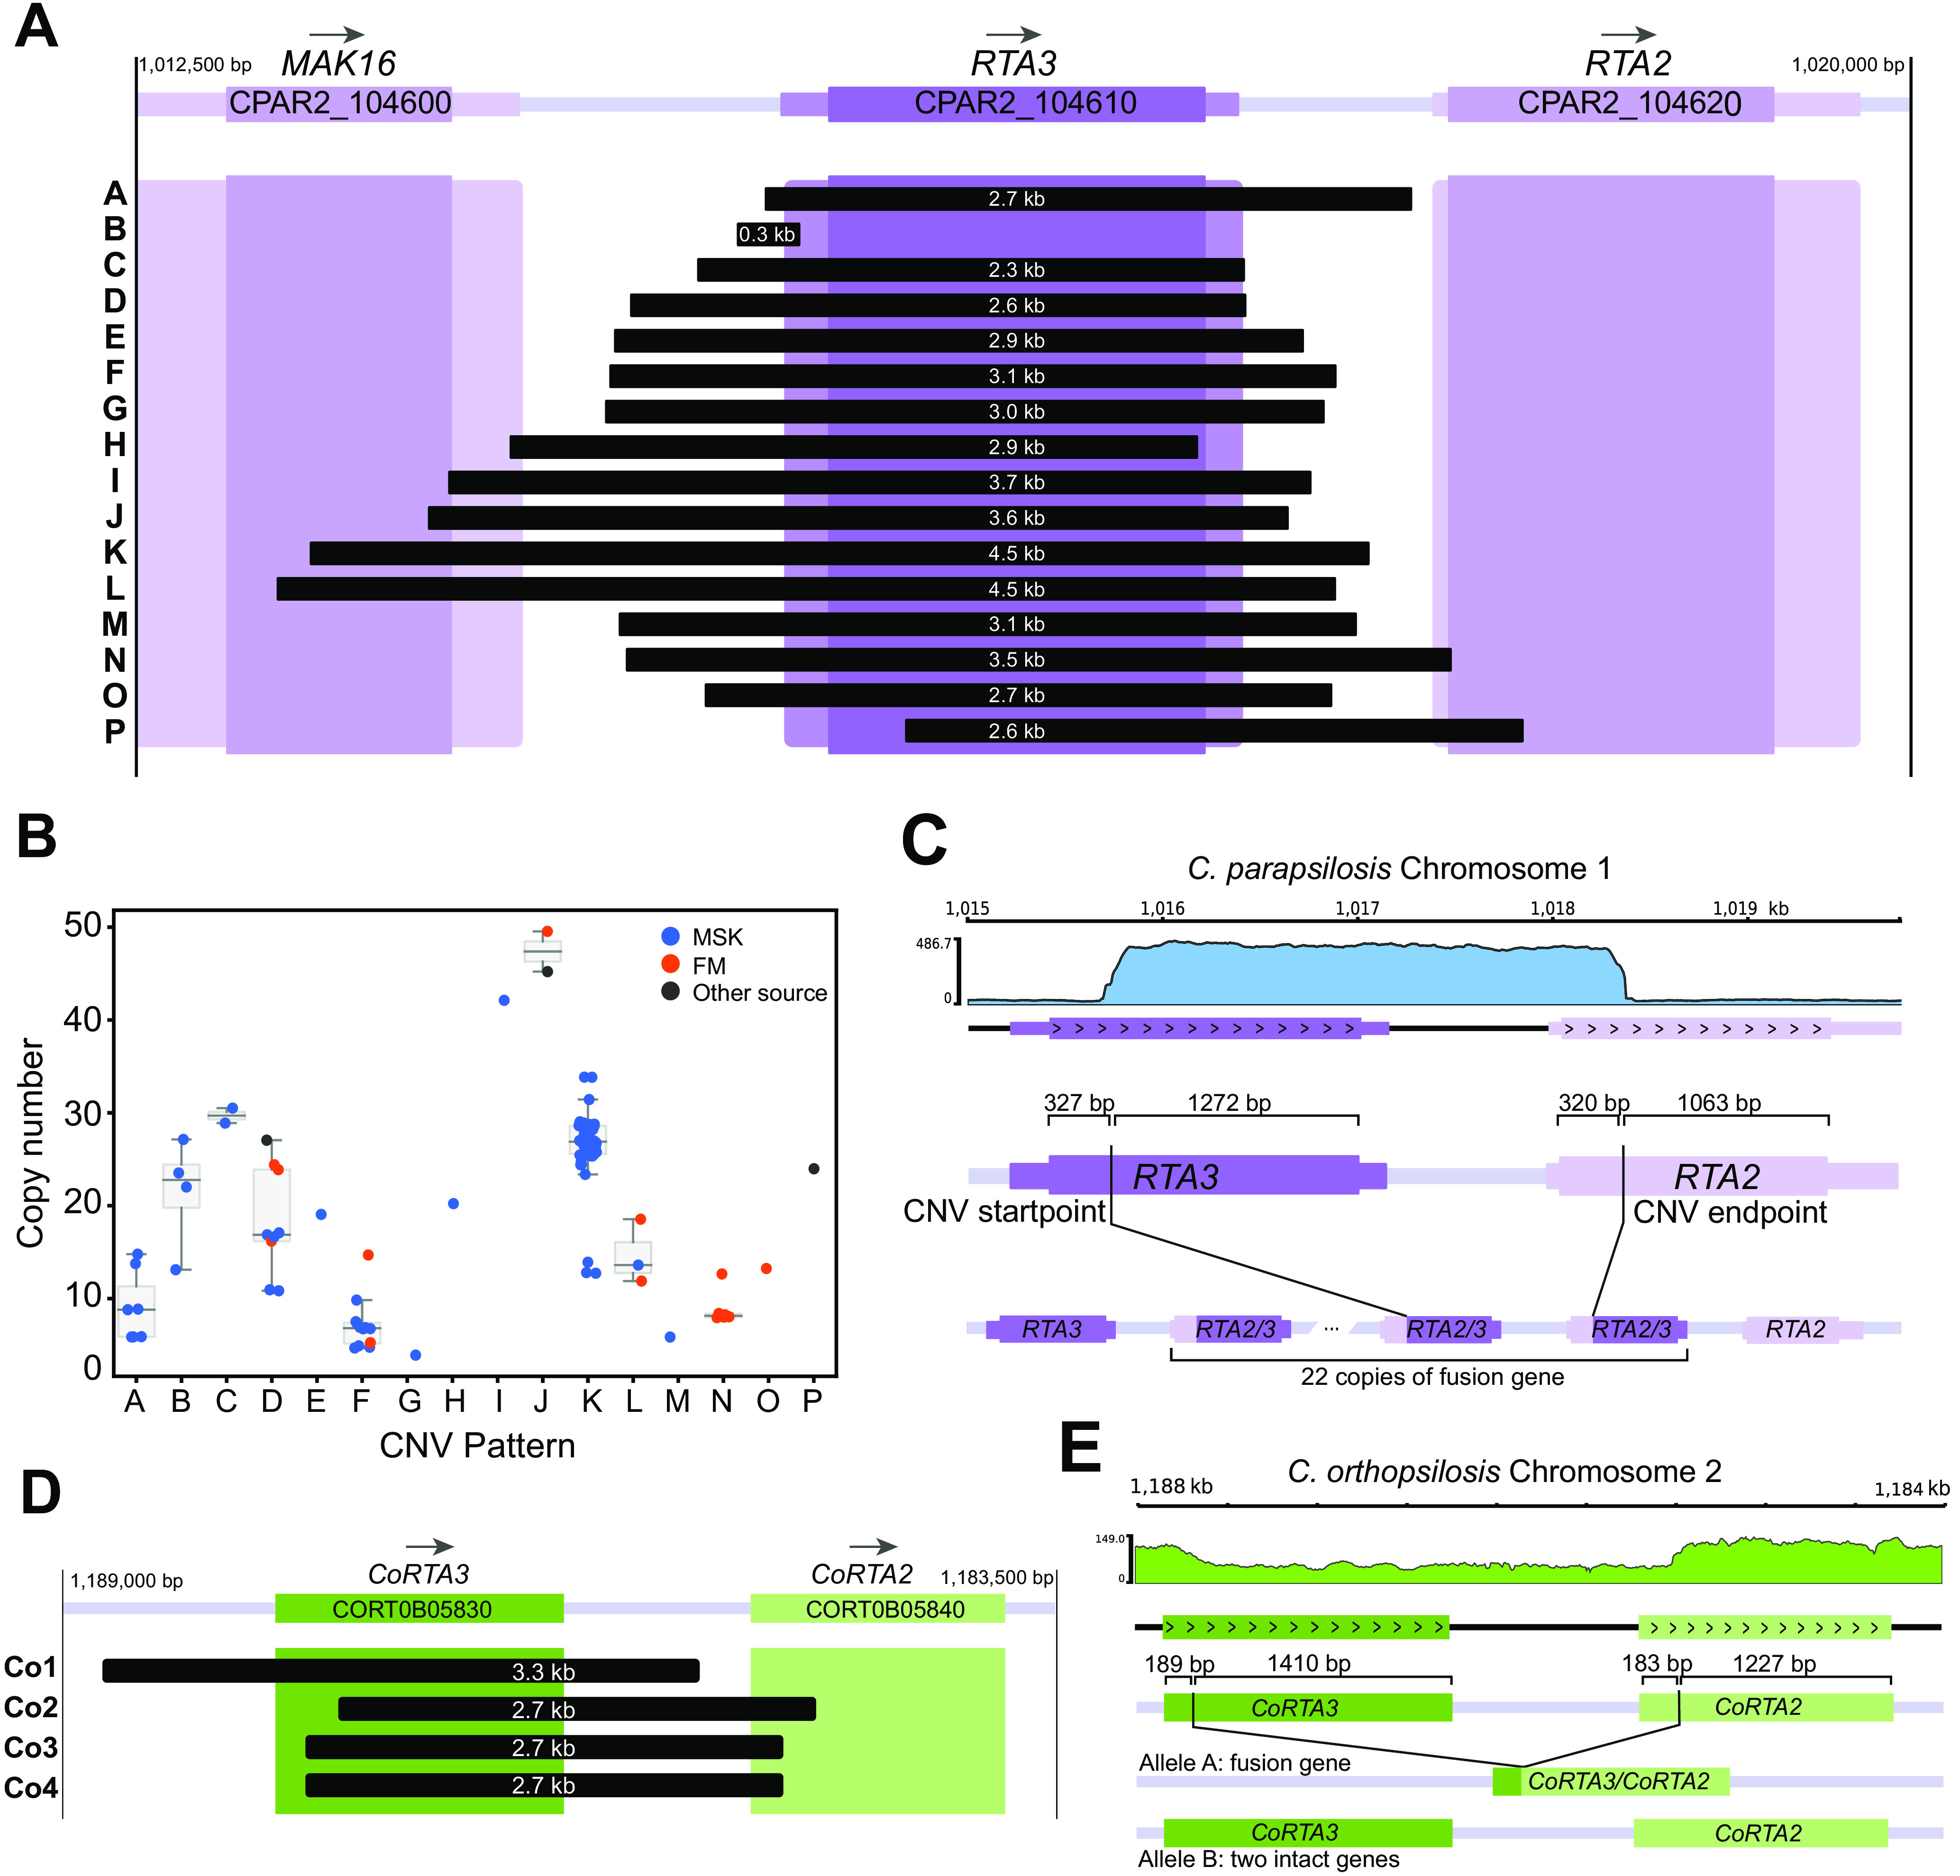
FIG 3.

CNVs amplify different sequences at the RTA3 locus. (A) Span of 16 different CNVs (from A to P) at the RTA3 locus in C. parapsilosis. The coding sequence of RTA3 is shown by a dark purple box, and the flanking UTRs are shown in a lighter color. The neighboring genes MAK16 and RTA2 are also shown. The extents of the tandemly repeating units in each of 16 CNVs are shown by black boxes, labeled (from A to P) on the left, and their lengths are indicated in white. Exact breakpoints were identified by interrogating split reads from the Illumina data, and the array structures of CNVs D and K were verified by MinION sequencing of isolates UCD321, MSK478, and MSK812. (B) Copy number of RTA3 in each C. parapsilosis isolate. Each dot represents a single isolate: blue isolates from MSK, red from CHU de Nantes (FM), and dark gray from other sources. Medians and interquartile ranges are shown for CNVs present in more than one strain. Dots are jittered for clarity. (C) RTA2/3 fusion gene in strain Kw3259-15 containing CNV-P. A coverage plot created by PyGenomeTracks (78) is shown at the top. The schematic shows the position of CNV breakpoints in relation to the CDS of both genes and the structure of the inferred array of fusion genes. (D) Amplifications of RTA3 in C. orthopsilosis in strain 434. The orientation of the chromosome has been flipped to highlight the similarities to RTA3 CNVs in C. parapsilosis. (E) A deletion in C. orthopsilosis generates a CoRTA3/CoRTA2 fusion. A coverage plot of the locus is shown at the top. The schematic shows CNV breakpoints in both CoRTA3 and CoRTA2 and how the resulting fusion gene is formed at one allele while leaving the other allele intact.
