
Figure 3.
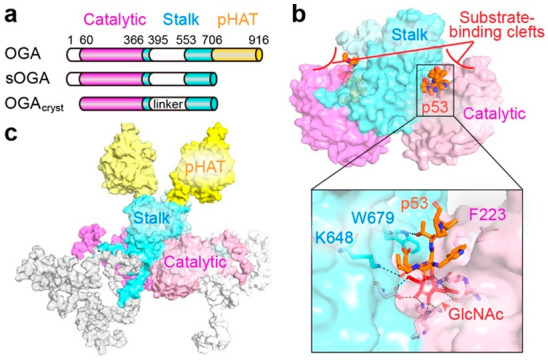
OGA structures provide clues to substrate recognition and protein interactions. (a) Schematic diagram of two OGA isoforms (OGA and sOGA) and OGAcryst, a reported crystallizable OGA construct. The catalytic domain, stalk domain, and pseudo histone acetyltransferase (pHAT) domain are shown in magenta, cyan, and yellow, respectively. Intrinsically disordered regions of OGA are shown in white. (b) The crystal structure of O-GlcNAcylated p53 peptide (highlighted in orange) bound in the substrate-binding clefts of OGAcryst dimer (PDB: 5UN8). Insert highlighted the p53 peptide interactions with OGA residues. (c) Predicted full-length OGA model with its domains colored as in (a).