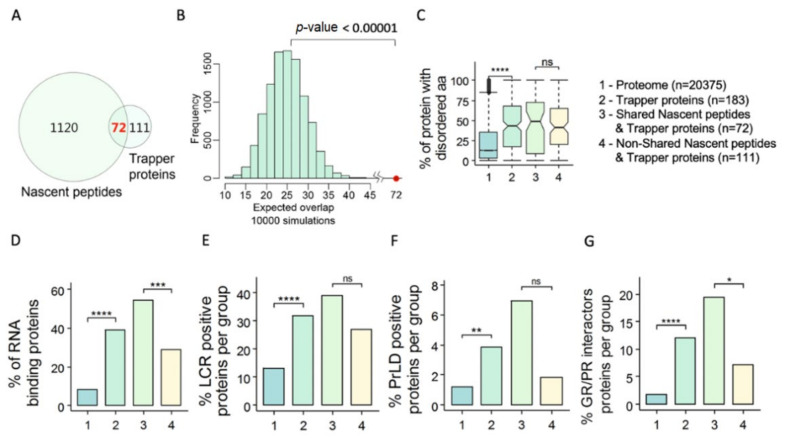
Figure 6.
Many of the PSMA3 trapper-binding proteins (TBPs) are proteasomal associated in the cells (A) Venn diagram of the nascent proteasome substrates (nascent peptides, 1192 proteins) and the PSMA3–BPs (trapper). (B) The expected overlap between the two groups in Panel A was evaluated by a Z-test with the null distribution calculated by 10,000 simulations. The expected average overlapped group is 20 proteins, whereas the observed number is 72 (red dot) (p-value < 0.00001). (C–G) Under this set of panels, the proteome (Group 1) is compared to the following groups: PSMA3–TBPs (Group 2 n = 183); proteins that are found in Group 2 and also in the nascent substrate proteins (Group 3 n = 72); proteins that are of PSMA3–TPs group but not found in the nascent substrate proteins (Group 4 n = 111). The comparison was conducted for: (C) the average disorder degree (Boxplot); (D) percentage of RBPs in the group; (E) percentage of proteins positive for low complexity region (LCR); (F) percentage of proteins positive for prion-like domain (PrLD); and (G) percentage of proteins positive for GR/PR di-peptide repeats interactor proteins. NS (non-significant) p > 0.05, * p ≤ 0.05, ** p ≤ 0.01, *** p ≤ 0.001, **** p ≤ 0.0001, using a two-tailed Student t test.

