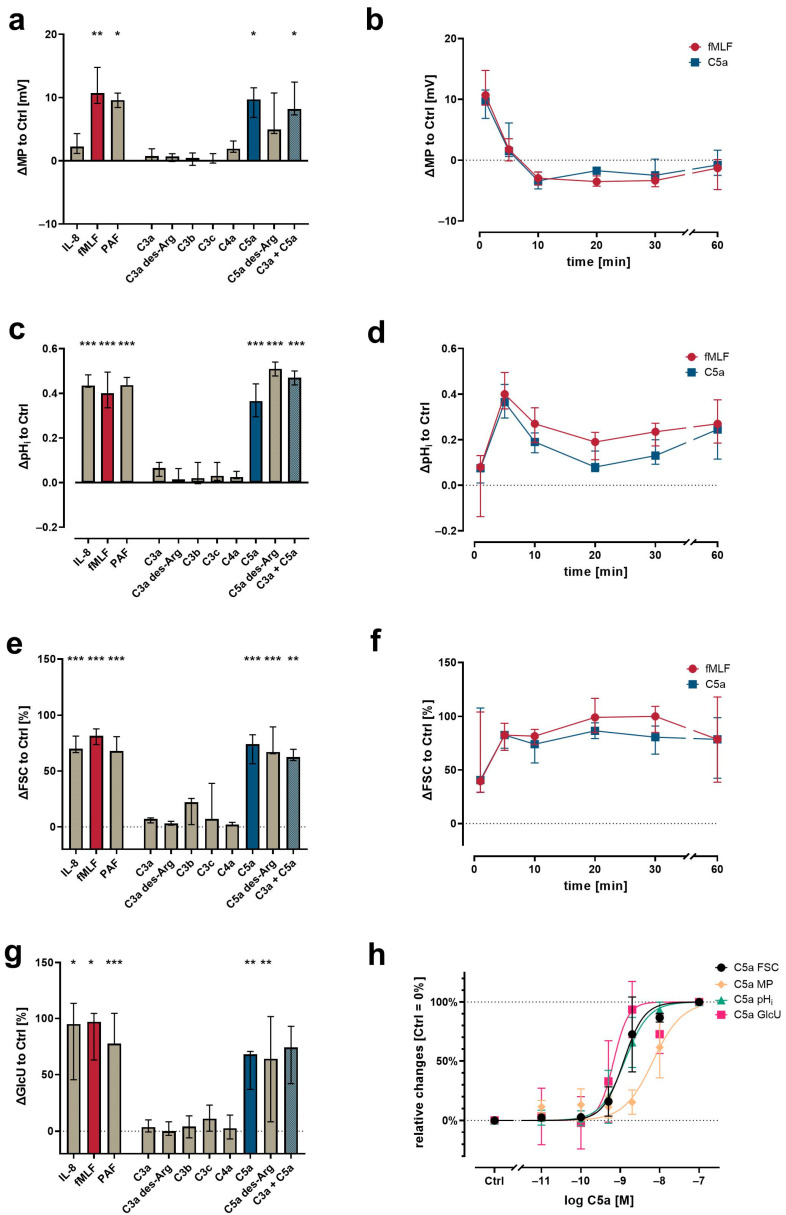
Figure 1.
Neutrophil physiological response upon exposure to complement cleavage products with respect to changes (a) of membrane potential (MP, measured by change in DiBAC4(3) fluorescence) 1 min after stimulation, (c) intracellular pH (pHi, measured by change in SNARF fluorescence) 5 min after stimulation, (e) cellular shape as indicated by FSC 10 min after stimulation, and (g) glucose uptake (GlcU, measured by change in 2NBDG fluorescence) as measured after 10 min of stimulation. Time curves summarize for the change in (b) MP, (d) pHi, and (f) cellular shape. (h) Summary of the concentration-dependency of the C5a-induced effects. Results are normalized to unstimulated neutrophils (= 0% or 0). The following concentrations were used: 10 nM C5a, 10 nM C5a des-Arg, 10 µM fMLF, 50 ng/mL IL-8, 100 nM C3a, 100 nM C3a des-Arg, 100 nM C3b, 100 nM C3c, or 100 nM C4a. n = 6–8, median ± interquartile range. *, **, and *** = p < 0.05, < 0.01, and < 0.001, respectively. Kruskal–Wallis test with uncorrected Dunn’s test.

