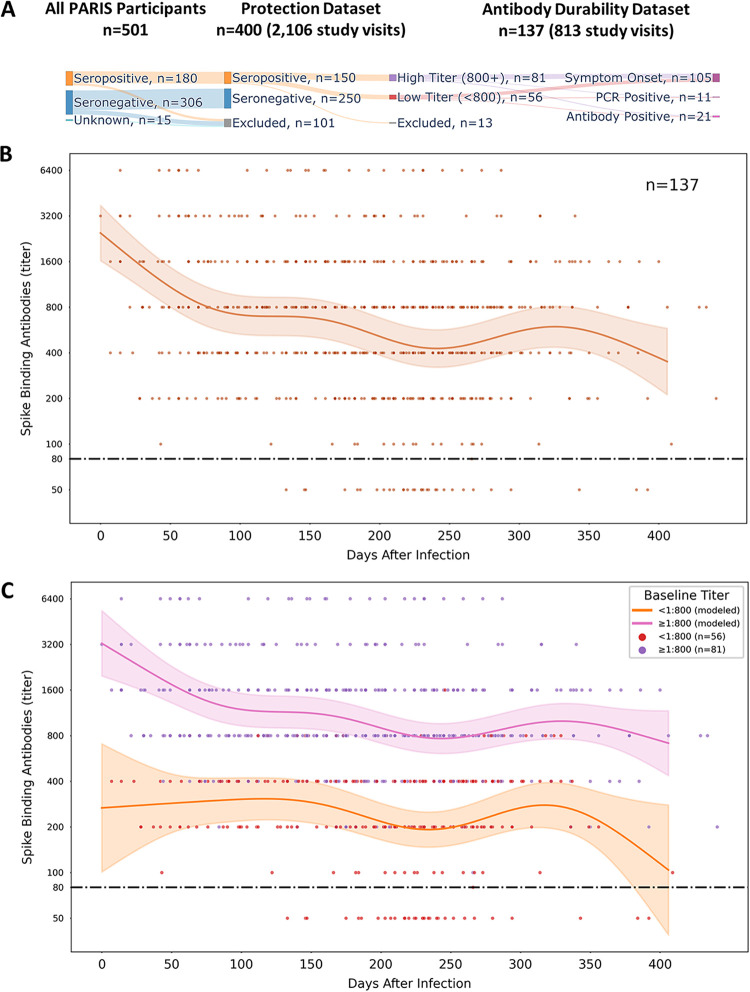
FIG 1.
Modeling SARS-CoV-2 antibody durability in PARIS participants. (A) Overview of the PARIS cohort data sets (protection, antibody durability) selected for the analysis of humoral responses mounted upon infection. (B) Durability of SARS-CoV-2 spike-binding antibodies over time. SARS-CoV-2 IgG binding antibody dynamics after infection were described in 137 PARIS participants by an additive mixed model. The early waning period is followed by stabilization. The date of SARS-CoV-2 infection was determined by a positive nucleic acid amplification test, onset of COVID-19 symptoms, or the date of first positive antibody test. Most participants were infected in the first wave of the pandemic. The limit of detection of the SARS-CoV-2 IgG antibody ELISA is set at a titer of 1:80 (dashed black line). The brown line represents the mean antibody titer value predicted by the model, and the light brown shaded region represents the 95% confidence interval of the mean. Individual antibody values are represented by dots. (C) SARS-CoV-2 antibody durability depends on the initial levels of antibodies. The antibody durability group was split by the antibody titer at enrollment (pink, ≥1:800, n = 81; orange, <1:800, n = 56). Both groups demonstrate broadly similar dynamics, with the early waning period being most evident in the group with higher initial SARS-CoV-2 spike-binding antibody titers. Titers equal to or above 1:800 were defined as high. The pink and orange lines represent the mean antibody titer value predicted by the model, and the light pink/orange shaded regions represent the 95% confidence interval of the mean. The dashed black line represents the 1:80 cutoff value. Individual antibody values are represented by dots (≥1:800, purple; <1:800, red).

