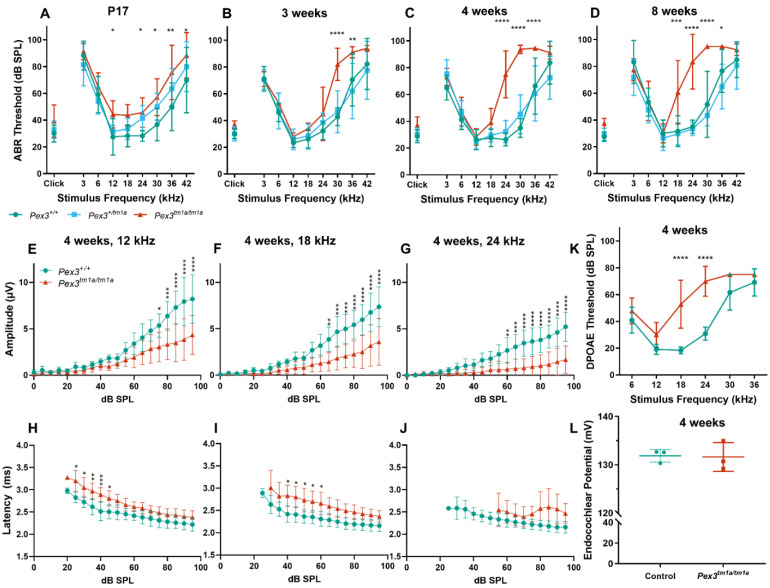
Figure 2.
(A–D) Following maturation, ABR thresholds of Pex3tm1a homozygotes (red) showed progressive high-frequency hearing loss while heterozygotes (blue) and wildtype littermates (green) had normal thresholds. Mean ± standard deviation. For each age group, there was a significant effect of mouse genotype (P17, F(2153) = 20.02, p < 0.0001; three weeks, F(2189) = 19.50, p < 0.0001; four weeks, F(2296) = 105.3, p < 0.0001; eight weeks, F(2257) = 114.7, p < 0.0001). Significant threshold elevations for each stimulus, from Tukey’s multiple-comparisons test, between Pex3+/+ and Pex3tm1a/tm1a animals, are indicated by * p ≤ 0.05, ** p ≤ 0.01, *** p ≤ 0.001, **** p ≤ 0.0001. n at P17 Pex3+/+ = 6, Pex3+/tm1a = 7, Pex3tm1a/tm1a = 7; at three weeks Pex3+/+ = 9, Pex3+/tm1a = 10, Pex3tm1a/tm1a = 5; at four weeks Pex3+/+ = 4, Pex3+/tm1a = 20, Pex3tm1a/tm1a = 12; at eight weeks Pex3+/+ = 3, Pex3+/tm1a = 15, Pex3tm1a/tm1a = 14. (E–J) Amplitudes and latencies of ABR wave 1 in mice aged four weeks. Homozygous mutants (red triangles) showed reduced amplitudes and extended latencies compared with the wildtype group (green circles). Input/output functions of ABR wave P1 latency and ABR wave 1 amplitude (mean ± standard deviation) are plotted vs. dB SPL, for 12 kHz (E,H), 18 kHz (F,I) and 24 kHz (G,J) stimuli. Two-way ANOVA revealed significant reductions in ABR wave amplitude (12 kHz, F (1260) = 80.51, p < 0.0001; 18 kHz, F (1260) = 112.2, p < 0.0001; 24 kHz, F (1180) = 136.2, p < 0.0001) and increases in P1 latency (12 kHz, F (1188) = 97.94, p < 0.0001; 18 kHz, F (1158) = 96.87, p < 0.0001; 24 kHz, F (1, 56) = 19.66, p < 0.0001) in homozygote Pex3tm1a/tm1a mice compared to wildtype littermate control mice. Significant changes at each dB SPL, from Sidak’s multiple-comparisons tests between Pex3+/+ and Pex3tm1a/tm1a mice are indicated by * p < 0.05, ** p < 0.01, *** p < 0.001, **** p < 0.0001. (K) Pex3tm1a homozygotes (red) showed increased thresholds for DPOAE thresholds compared with wildtype littermate controls (green) at four weeks old. n = 6 wildtypes, 7 homozygous mutants. Two-way ANOVA revealed a significant effect of mouse genotype (F(1,66) = 74.65, p < 0.0001). Sidak’s multiple-comparisons test indicated significant elevations in DPOAE threshold at f2s of 18 kHz (p < 0.0001) and 24 kHz (p < 0.0001). (L) Pex3tm1a homozygotes (red) showed normal endocochlear potential in comparison with control WT littermates (green). The graph shows individual dots for each mouse and the mean (±SD) for both WT (green) and mutant (red) mice; 131.6 +/−3.0 mV in homozygous mutants; 131.9 +/−1.3 mV in littermate controls; n = 3 of each genotype. Data analysed by one-way ANOVA (p = 0.904).

