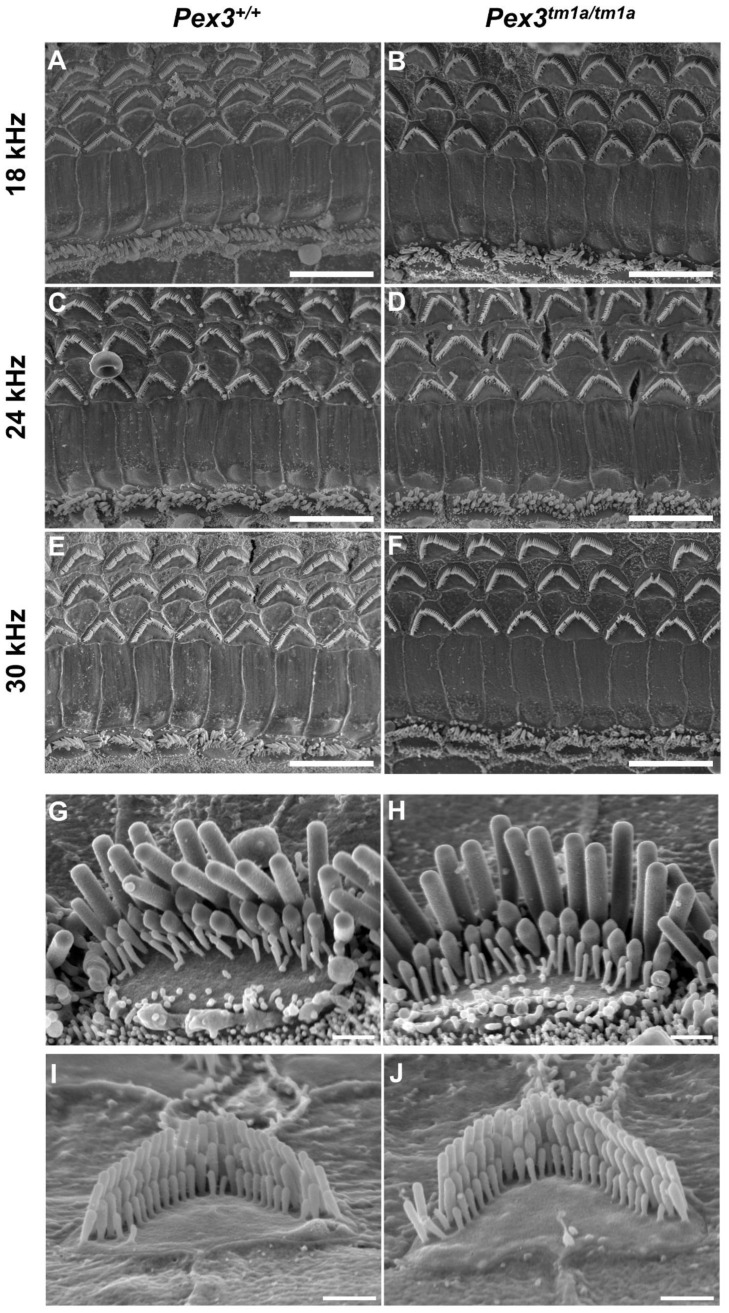
Figure 3.
Scanning electron micrographs of the organ of Corti at four weeks old. Left column, wildtypes; right column, homozygous Pex3tm1a mutants. (A–F) low magnification images of the surface of the organ of Corti at three characteristic-frequency locations: (A,B) 18 kHz; (C,D), 24 kHz; (E,F) 30 kHz regions. (G–J), Higher magnification of stereocilia bundles. (G,H) inner hair cells from 24 kHz frequency region; (I,J), outer hair cells from 12 kHz frequency region, showing no obvious differences between Pex3tm1a mutants and controls. Occasionally, missing stereocilia bundles were observed in OHCs in both mutant and control samples. n = 7 for each genotype. Scale bars (A–F), 10 μm; (G–J), 1 μm.

