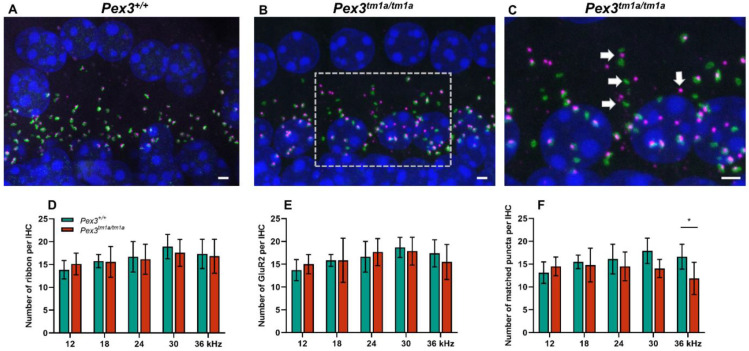
Figure 4.
Synapses below inner hair cells shown by close apposition of the pre-synaptic ribbon (Ribeye, magenta) and the post-synaptic density (GluR2, green) in Pex3tm1a homozygotes and wildtype controls. Nuclei are labelled with DAPI, blue. Maximum projection confocal images. (A) Wildtype mouse at four weeks old, 30 kHz best-frequency region. (B) Pex3tm1a homozygous littermate. (C) Enlargement of box in B with white arrows pointing to separated pre- and post-synaptic components. (D–F) plots of numbers of ribbons per IHC (D), post-synaptic densities per IHC (E) and intact synapses per inner hair cell (F) at different cochlear regions, wildtypes in green, homozygous mutants in red. All data passed the normality and equal-variance tests. Two-way ANOVA revealed significant reductions in number of matched puncta (F (1, 50) = 7.042, p = 0.0106) in Pex3tm1a homozygotes in comparison with littermate controls, but not in the number of ribbons (F (1, 50) = 0.1208, p = 0.7296) nor GluR2 puncta (F (1, 50) = 0.008970, p = 0.9249). Significant changes at each frequency, from Sidak’s multiple-comparisons tests between Pex3+/+ and Pex3tm1a/tm1a mice are indicated by * p < 0.05. Scale bar, 2 μm; n = 6 for each genotype. Number of synapses/IHC (±SD): Pex3+/+ control mice 12 kHz 13.13 ± 2.35; 18 kHz 15.50 ± 1.49; 24 kHz 16.11 ± 3.24; 30 kHz 17.91 ± 2.78; 36 kHz 16.63 ± 2.73. Pex3tm1a/tm1a mutant mice 12 kHz 14.50 ± 2.05; 18 kHz 14.05 ± 2.00; 24 kHz 14.52 ± 3.14; 30 kHz 14.06 ± 1.98; 36 kHz 11.87 ± 3.54.

