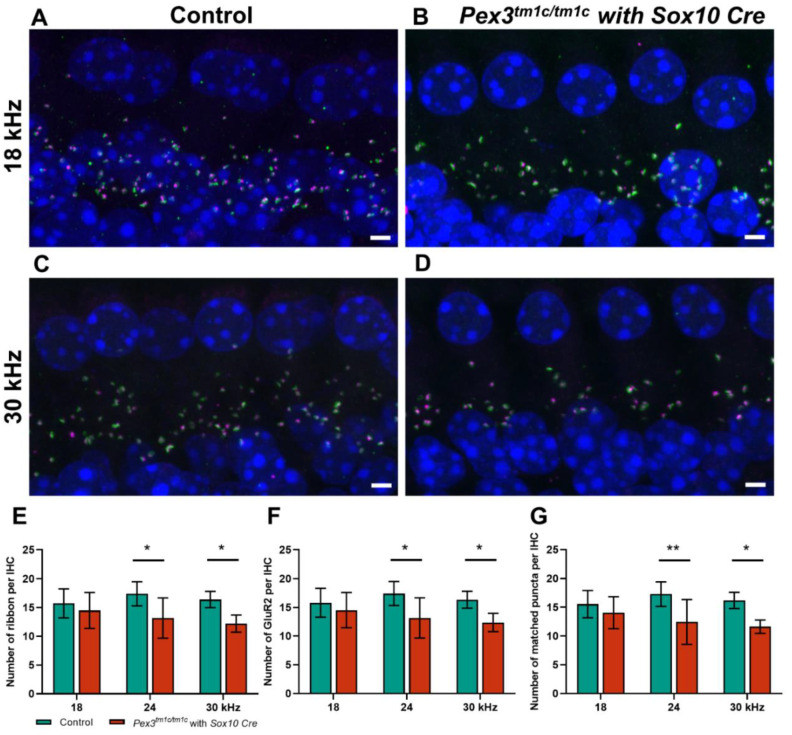
Figure 6.
(A–D) Maximum projection confocal images of Pex3tm1d homozygotes (B,D) and their littermate controls (A,C) aged four weeks at 18 and 24 kHz best-frequency locations. Pre-synaptic ribbon (Ribeye, magenta); post-synaptic density (GluR2, green); nuclei (DAPI, blue). (E–G) numbers of intact synapses per inner hair cell at different cochlear regions; controls in green; homozygous mutants in red. All synaptic data passed the normality and equal-variance tests. Two-way ANOVA revealed significant reductions in number of matched puncta (F (1, 27) = 18.53, p = 0.0002), ribbons (F (1, 27) = 14.10, p = 0.0008) and GluR2 puncta (F (1, 27) = 13.70, p = 0.0010) in Pex3tm1d homozygotes in comparison with littermate controls. Significant changes at each frequency, from Sidak’s multiple-comparisons tests between Pex3+/+ and Pex3tm1d/tm1d mice, are indicated by * p < 0.05 and ** p < 0.01. Scale bar, 2 μm; n, Pex3+/+ = 6 and Pex3tm1d/tm1d = 5. Number of synapses/IHC (±SD): Control 18 kHz 15.55 ± 2.37; 24 kHz 17.26 ± 2.39; 30 kHz 16.19 ± 1.40. Pex3tm1d/tm1d mutants 18 kHz 14.05 ± 2.79; 24 kHz 12.45 ± 3.90; 30 kHz 11.63 ± 1.15.

