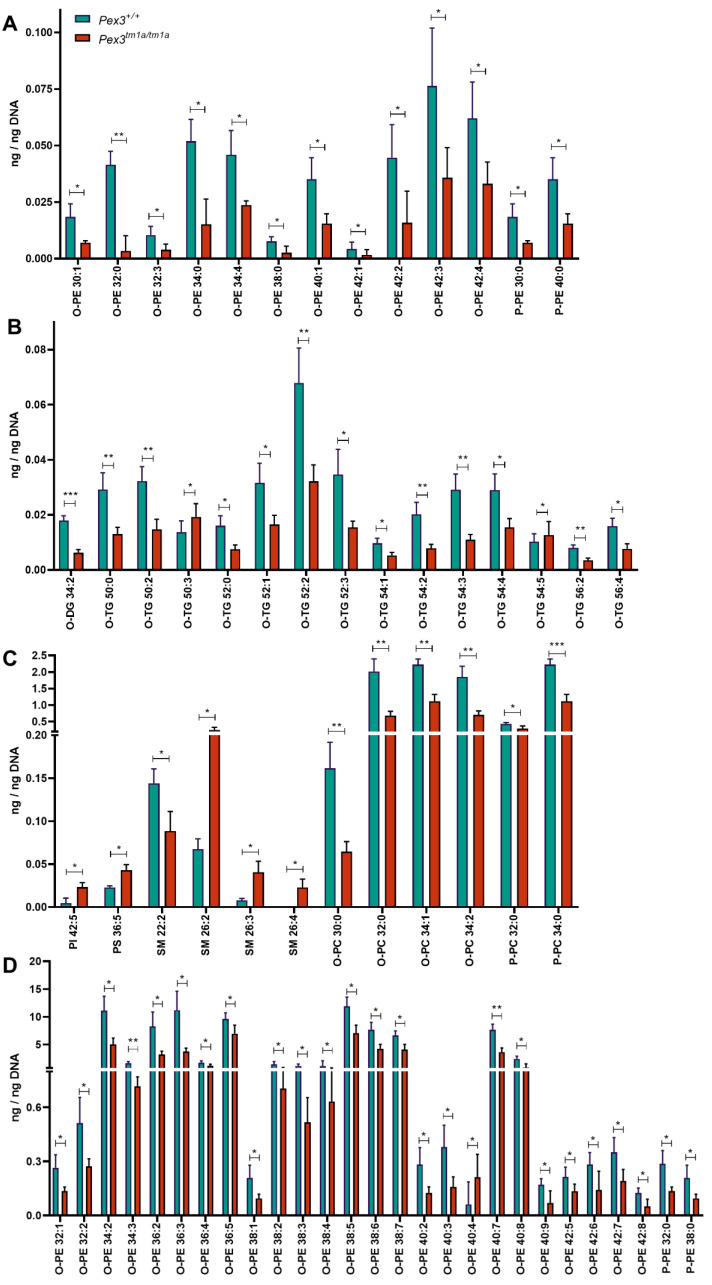
Figure 7.
Lipidomics analysis of whole inner ears. (A–D) The mean of the four Pex3tm1a mutant homozygote inner ear samples was compared with the mean of their littermate wildtype controls. Out of 671 lipid molecular species analysed, only the quantities (ng/ng DNA) of single molecular species showing a significant decrease or increase are plotted. t-test, * p < 0.05, ** p < 0.01, *** p < 0.001. Abbreviations of lipid subclasses are given in Table 1. Supplementary Table S1 presents the quantities per mouse sample of all 671 lipid molecular species examined.

