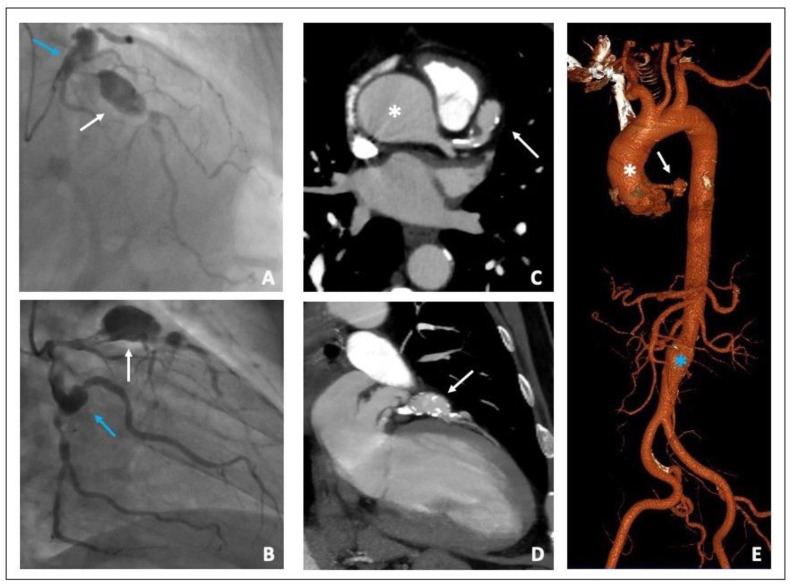
Figure 2.
(A,B) Coronary angiography. (A) Proximal LAD giant aneurysm (white arrow) followed by a severe stenosis. Proximal left circumflex artery ectasia (blue arrow). (B) Proximal left circumflex artery ectasia (blue arrow) followed by a severe stenosis of the distal segment. Proximal LAD giant aneurysm (white arrow) (C,D) MSCTA Cardiac short and long axis view showing both ascending aorta (white asterisk) and LAD aneurysms (white arrow). (E) 3D aortic reconstruction image: Ascending (white asterisk) and infra-renal aortic aneurysms (blue asterisk) and LAD aneurysm (white arrow). LAD (left anterior descending); MSCTA (multi-slice computed tomography angiography).

