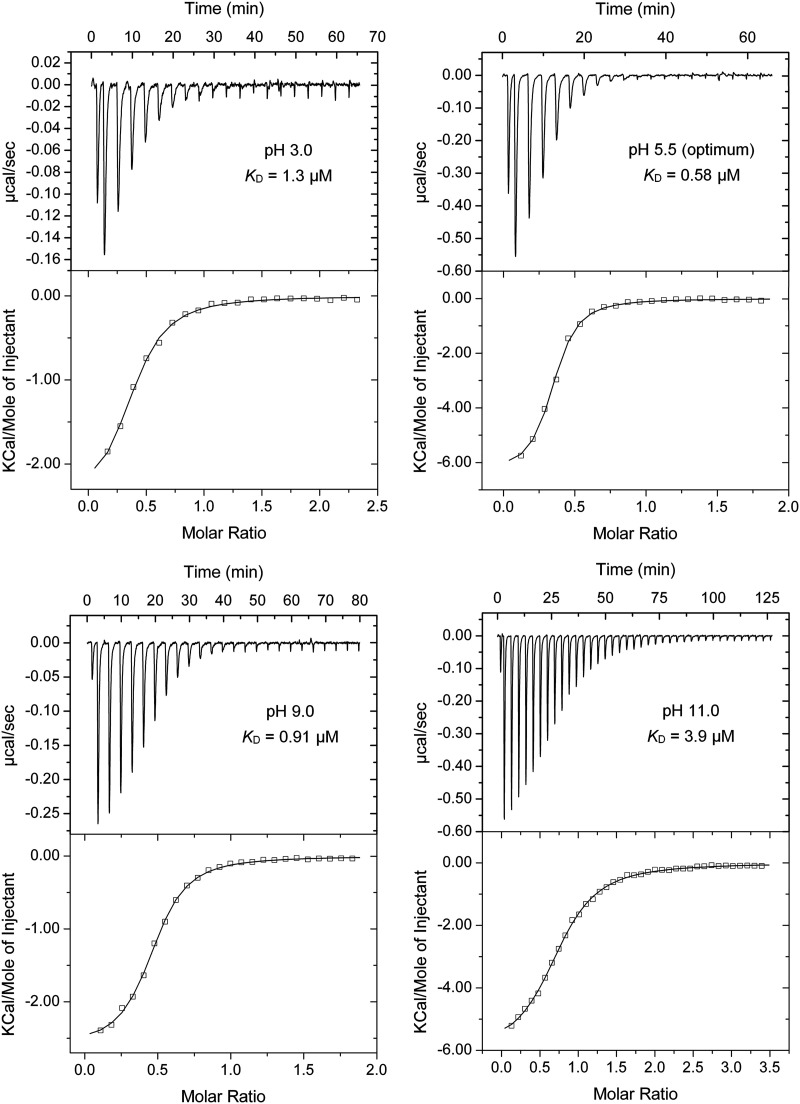
FIG 2.
Microcalorimetric titrations of P. aeruginosa PctA-LBD with L-Ala in buffers of different pH. The protein concentration was between 20 and 31 μM and the concentration of L-Ala was 1 mM. Upper panel: raw titration data. The pH and corresponding dissociation constant (KD) are shown. Lower panel: dilution-heat-corrected and concentration-normalized integrated raw data. Data were fitted with the “One-Binding Site Model” of the MicroCal (Northampton, MA, USA) version of ORIGIN. The derived thermodynamic parameters are shown in Table S2. The dissociation constant pH profile was flat and showed very little variation over the pH range 3.0 to 11.0, for which an average dissociation constant (KD) of 1.26 ± 0.7 μM was derived. The high affinities at the extreme pH values of 3.0 and 11.0, with KD values of 1.3 and 3.9 μM, respectively, are noteworthy (Fig. 2 and Fig. 3A).

