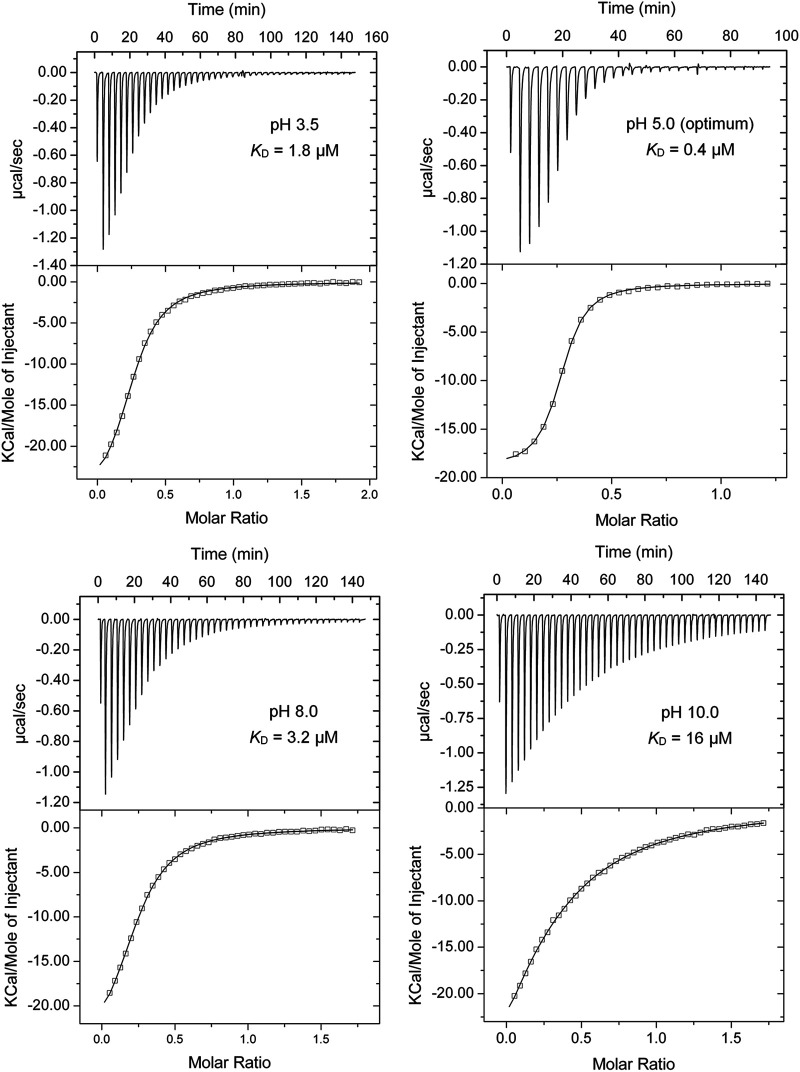
FIG 4.
Microcalorimetric titrations of the E. coli Tar-LBD with L-Asp in buffers with different pH values. The protein concentration was between 32 and 37 μM, and the concentration of L-Asp was 300 μM. Upper panel: raw titration data. The pH and the corresponding KD are shown. Lower panel: dilution-heat-corrected and concentration-normalized integrated raw data. Data were fitted with the “One-Binding Site Model” of the MicroCal (Northampton, MA, USA) version of ORIGIN. The derived dissociation constants are shown in Table S2.

