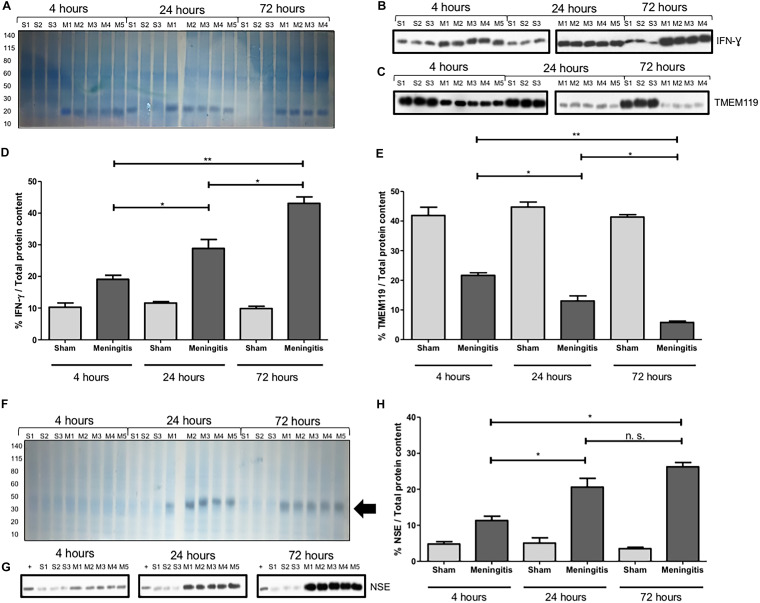
FIG 7.
Neuroinflammation and neuronal damage increase over time during pneumococcal infection with a malfunctioning glymphatic system. (A) The total protein content of brain homogenate samples was measured after Coomassie staining. S, sham (noninfected) control; M, meningitis. The numbers 1 to 5 refer to the rat number in the group (sham or meningitis) per time point. (B and C) Western blot detection of IFN-γ (B) and TMEM119 (C) was performed using brain homogenate samples of rats from sham and meningitis groups. Since both TMEM119 and IFN-γ are, respectively, microglial and microglial/macrophage markers present in the brain independently from the infection, brain homogenates from three sham rats were analyzed. Due to excessive bleeding, one brain (M5) from the 72-h time point was not used for this analysis. (D and E) The percentages of IFN-γ/total protein content (D) and TMEM119/total protein content (E) were finally calculated using ImageJ. Data are shown as mean and standard deviation. *, P < 0.05; **, P < 0.01; n.s., nonsignificant. As a negative control, brain homogenate samples from three rats of the sham group per time point were analyzed. The numbers 1 to 5 refer to the rat number in the group (sham or meningitis) per time point. (The total protein content was measured after the Coomassie staining shown in Fig. 6A.) (F) The total protein content of serum samples was first measured after Coomassie staining. S, sham control; M, meningitis. The numbers 1 to 5 refer to the rat number in the group (sham or meningitis) per time point, and the black arrow points toward an enhanced intensity of the Coomassie staining around the molecular weight of NSE (around 40 kDa), which is particularly evident for the meningitis group at 24 and 72 h. (G) The same volume of the same samples was then used for Western blot analysis for the detection of NSE. A lysate of differentiated neurons from SH-SY5Y cells was used as a positive control (+). (H) The percentage of NSE/total protein content was finally calculated using ImageJ, and data are shown as mean and standard deviation. *, P < 0.05; n.s., nonsignificant.

