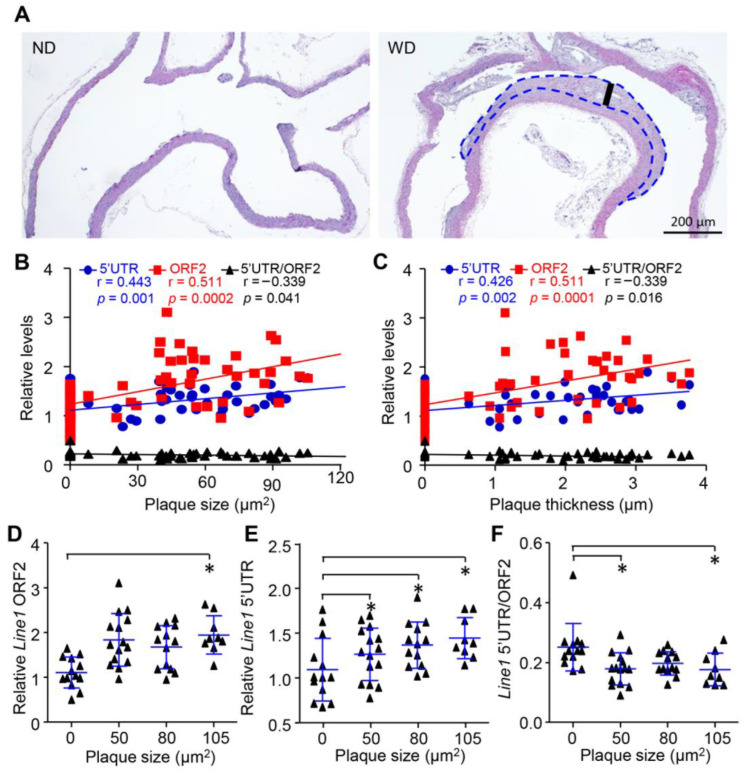
Figure 4.
Release and cleavage of cfDNA was associated with plaque progression in vivo. (A), HE staining of aorta from ApoE−/− mice fed with WD and ND for 6 months. (B,C) Spearman correlation for cfDNA concentration correlated with carotid plaque size (B) and thickness (C). (D,F) Levels of short fragment (D), long fragment (E) and integrity (F) of cfDNA among different levels of plaque size. Data are shown as mean ± SEM and were evaluated by unpaired t test. * p < 0.05.

