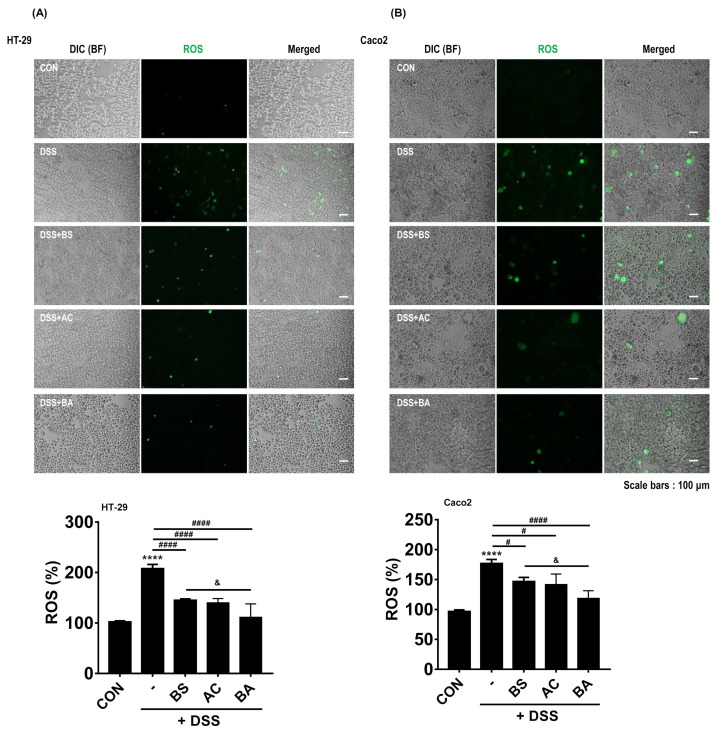
Figure 5.
Effect of BA on ROS generation in DSS-treated cells. (A,B) Reduced ROS generation was shown by DCFH-DA staining in 2% DSS-treated HT-29 and Ca-co2 cells incubated with or without 200 μg/mL BS (BS:AC, 100:0), AC (BS:AC, 0:100), and BA (BS:AC, 50:50) analyzed by fluorescence microscopy (upper panels). All pictures are representative of multiple images from three independent experiments (scale bars: 100 μm). Quantification of ROS level in percentage DCFH-DA fluorescence in DSS-treated HT-29 and Caco2 cells incubated with 200 μg/mL BS, AC, and BA for 24 h. Fluorescence levels were performed as described (Section 2.10). The bar graph illustrates ROS generation normalized to and statistically compared to each group (bottom panels). Statistical differences were determined by one-way ANOVA with Tukey’s post-hoc test (n = 3 per group, **** p < 0.0001 vs. CON; # p < 0.05, #### p < 0.0001 vs. DSS; & p < 0.05 vs. BS).

