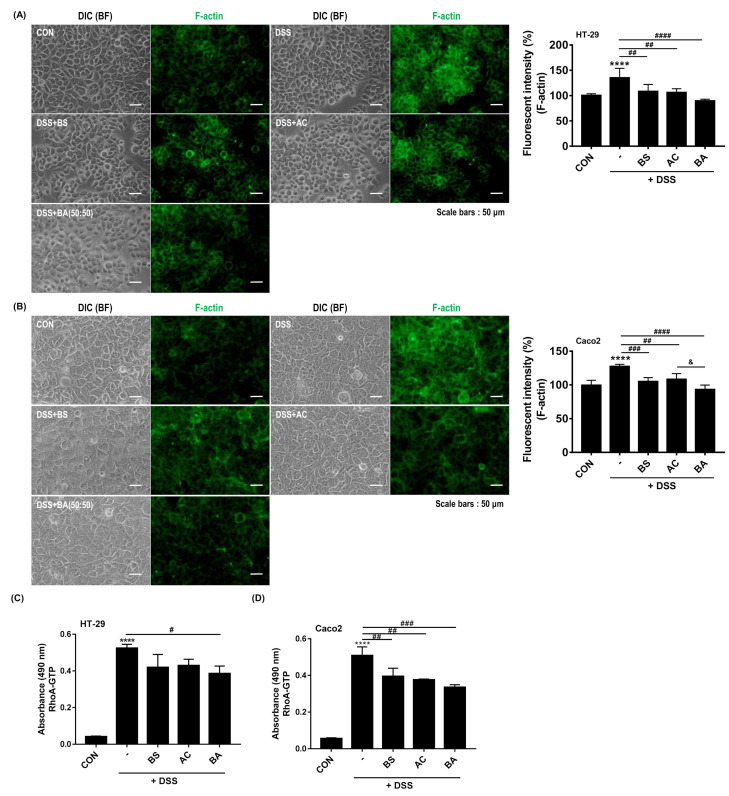
Figure 6.
Effect of BA on F-actin formation and RhoA activity in DSS-treated cell lines. (A,B) Immunocytochemical staining for F-actin in 2% DSS-treated HT-29 and Caco2 cells with or without 200 μg/mL BS (BS:AC, 100:0), AC (BS:AC, 0:100), and BA (BS:AC, 50:50) for 24 h. Cells were fixed with 4% paraformaldehyde (PFA) and permeabilized with 0.2% Triton X-100 in PBS. F-actin was stained with Alexa Fluor 488-phalloidin. All pictures are representative of multiple images from three independent experiments (scale bars: 50 μm). Measurement of F-actin level performed as described (Section 2.11). Bar graph illustrates F-actin formation normalized to and statistically compared to each group (n = 5–8 per group **** p < 0.0001 vs. CON; ## p < 0.01, ### p < 0.001, #### p < 0.0001 vs. DSS; & p < 0.05 vs. AC, right panels). (C,D) Measurement of RhoA-GTP by G-LISA RhoA activation assay in DSS-treated cells with or without BS, AC, and BA. The values were expressed as the mean ± SD of three independent experiments. Statistical differences were determined by one-way ANOVA with Tukey’s post-hoc test (n = 3 per group, **** p < 0.0001 vs. CON; # p < 0.05, ## p < 0.01, ### p < 0.001 vs. DSS).

