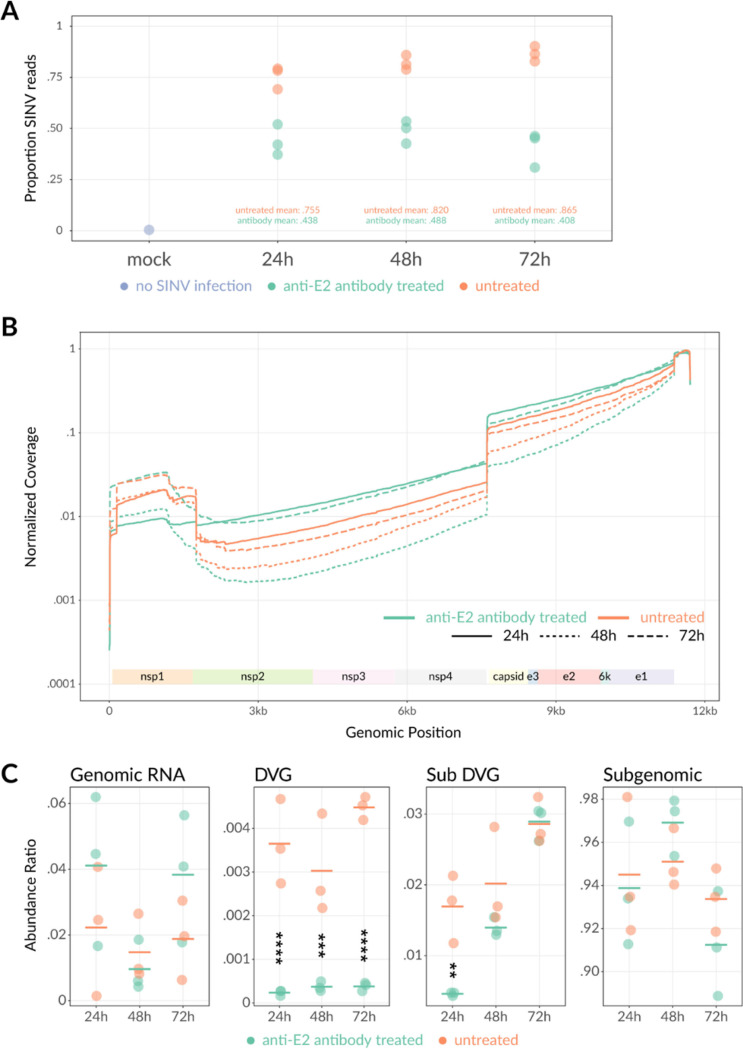
FIG 2.
Nanopore sequencing of SINV-infected differentiated AP-7 cells with or without anti-E2 antibody treatment. Differentiated AP-7 cells were infected with SINV (MOI of 10) and mock treated or treated with anti-E2 antibody (5 μg/mL) 4 h after infection. At 24, 48, and 72 h after infection, total intracellular RNA was collected in triplicate, enriched for poly(A), directly sequenced via nanopore sequencing, and aligned to the rat or SINV genome. (A) Proportion of RNA reads that align to the rat versus SINV genome. Proportions indicate the number of rat or SINV reads divided by the total number of RNA reads at each time point for mock-infected cells. The mock-infected 24-h sample is indicated in purple. (All mock time points had 0 SINV-aligned reads.) SINV-infected no-antibody-treatment samples are indicated in orange, and SINV-infected antibody-treated samples are indicated in green. Each dot indicates a different biological replicate. (B) Averaged sequence coverage of SINV-aligned RNA reads. Coverage plots indicate relative sequencing depth normalized to run yield across the SINV genome with (green) or without (orange) antibody treatment at 24, 48, and 72 h after infection. Coverage data represent the average of 3 biological replicates. (C) Reads were classified into genomic, subgenomic, DVG, or subDVG SINV RNA species using coverage differences at junction locations (see Materials and Methods). Abundance ratios for each species were calculated as a proportion of total SINV reads for each sample. Each point represents 1 biological replicate, and horizontal lines indicate the mean from 3 biological replicates. **, P < 0.01; ***, P < 0.001; ****, P < 0.0001.

