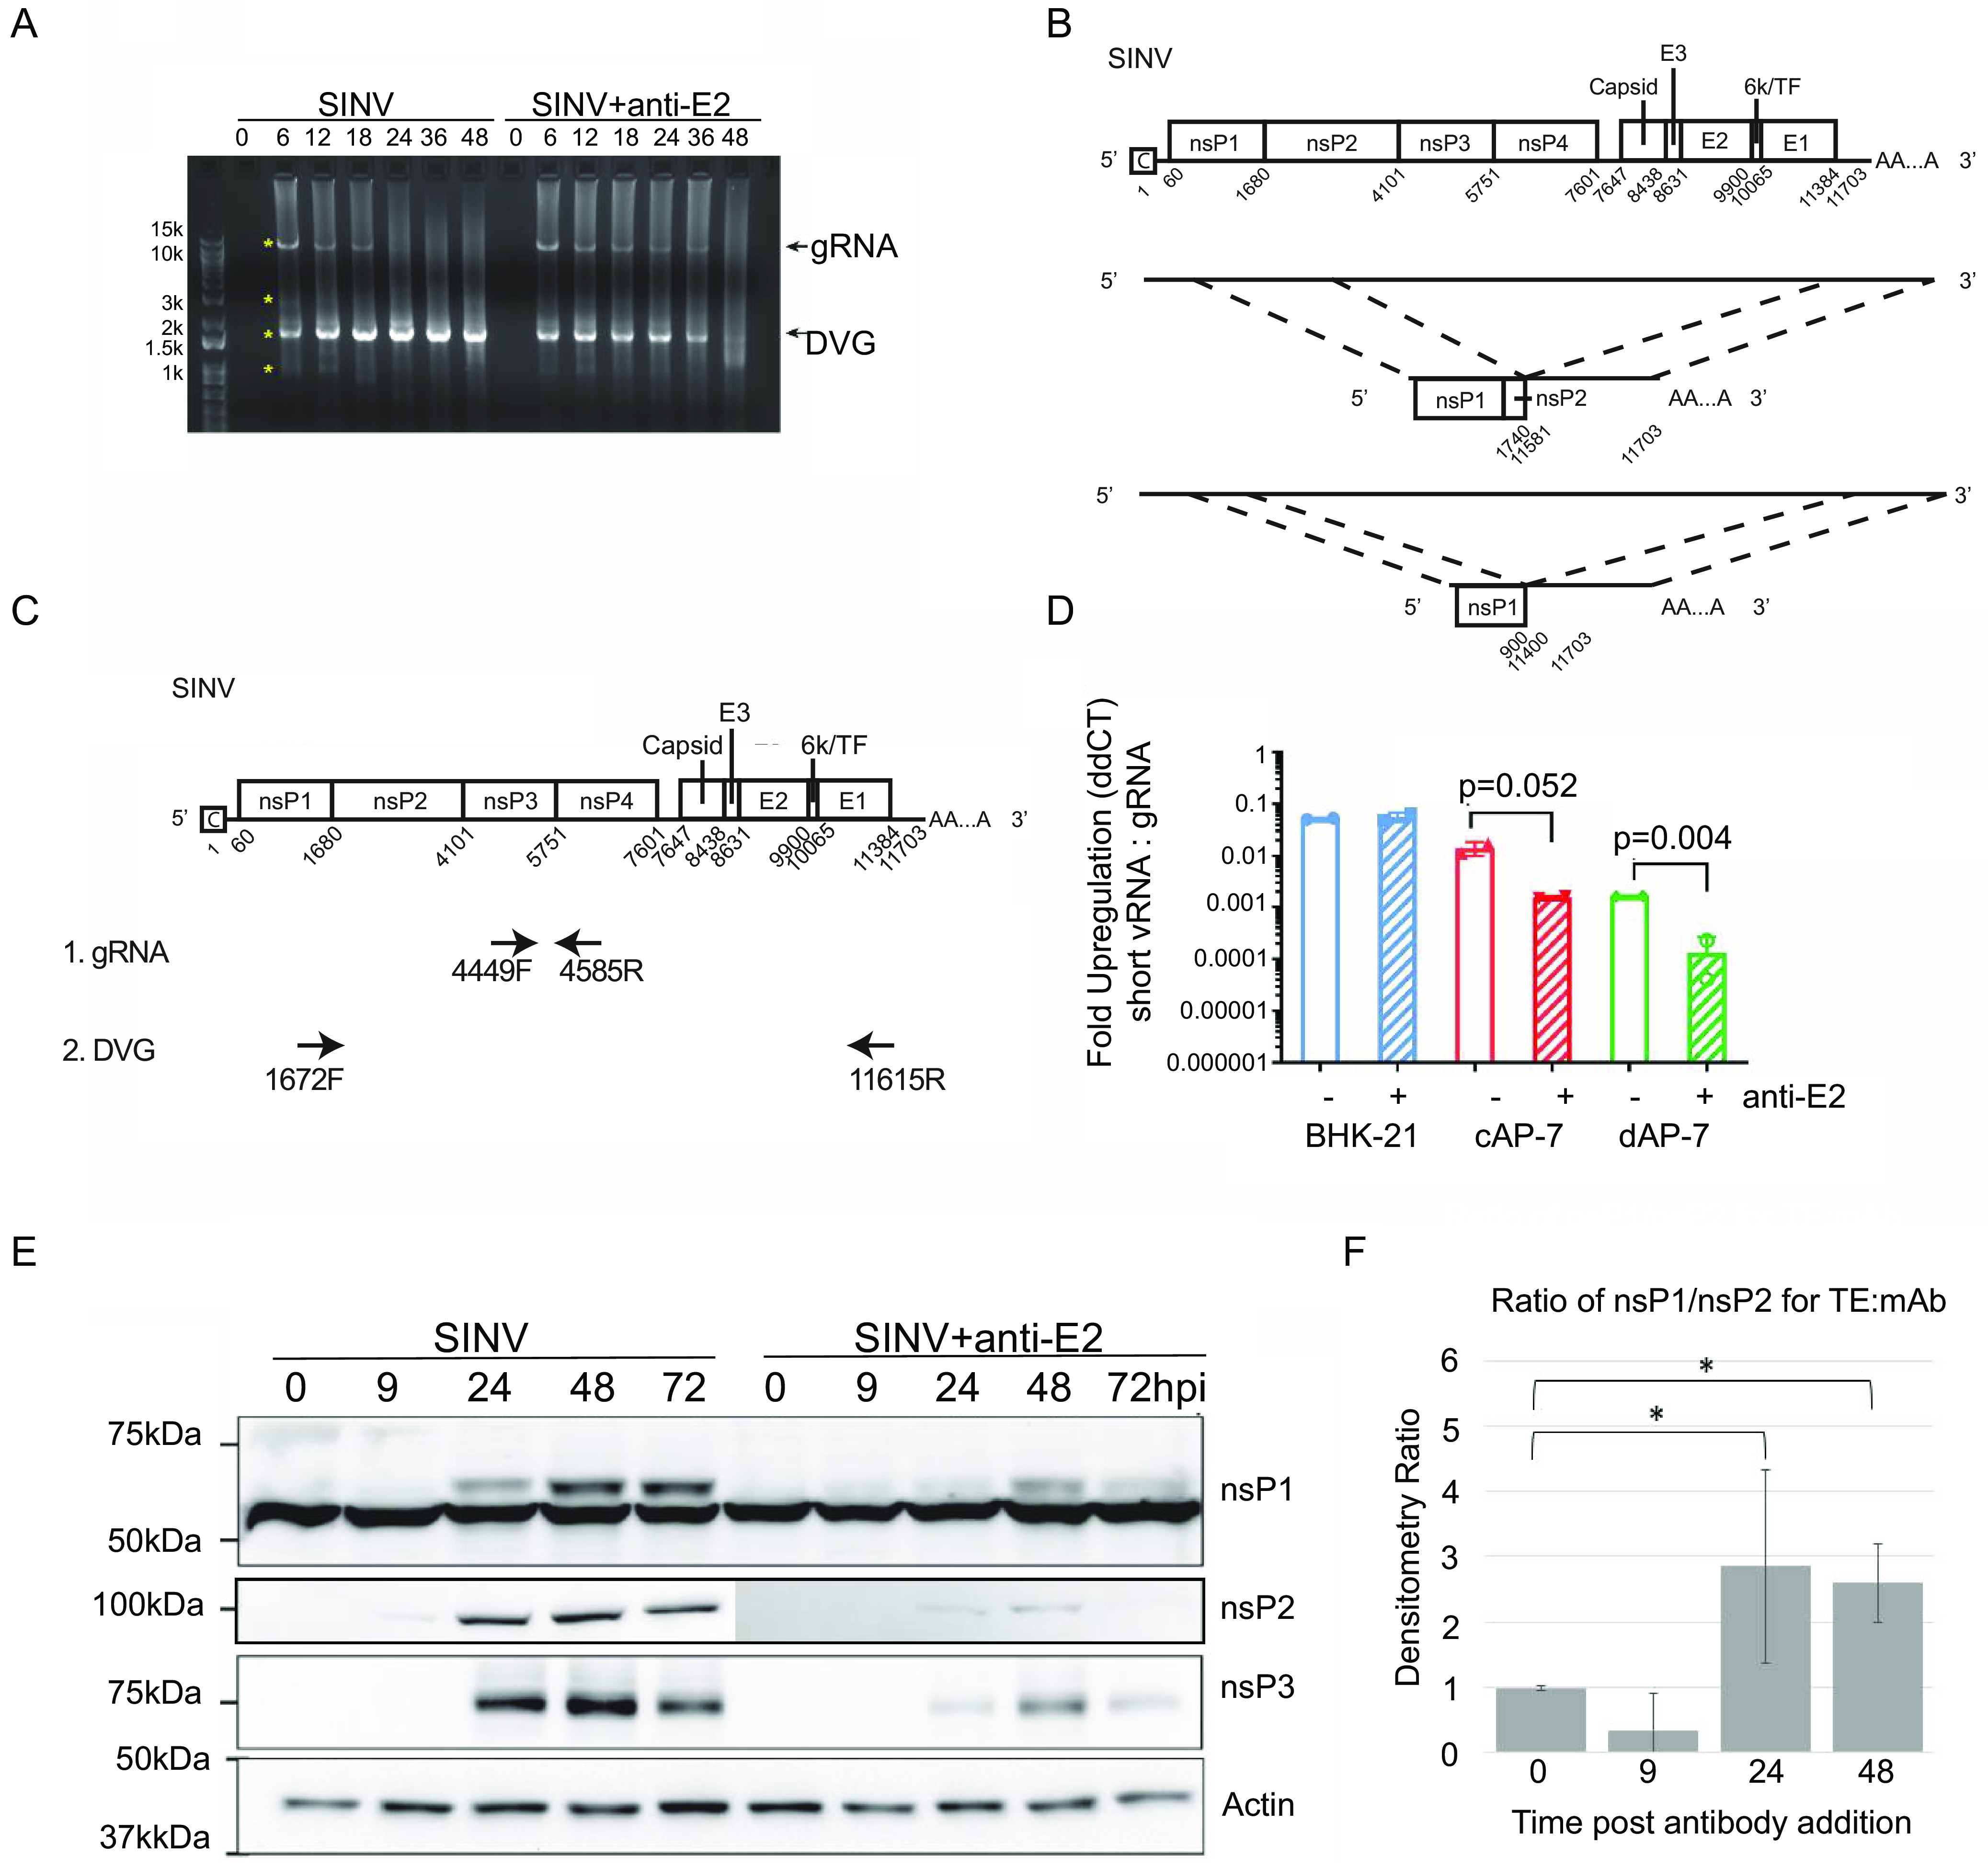
FIG 4.

Antibody treatment increases SINV genomic RNA and decreases nsP1 defective viral genome RNA levels in dAP-7 cells. (A and B) Differentiated AP-7 cells were infected with SINV (MOI of 10) and treated with anti-E2 antibody (5 μg/mL) or medium (mock) at 4 h after infection. At the indicated time points, total cellular RNA lysates were collected. (A) Semiquantitative RT-PCR for SINV RNA using primers against the 5′ and 3′ ends of the SINV genome (SV-171F, SV-11655R). “gRNA” represents full-length SINV genomic RNA, and “DVG” represents the nsP1 defective viral genome. Asterisks indicate PCR bands excised for DNA extraction and Sanger sequencing. (B) SINV genome sequence alignment of the two defective viral genome sequences identified. (C and D) Differentiated AP-7 cells (dAP-7), undifferentiated cycling AP-7 cells (cAP-7), and BHK-21 cells were infected with SINV (MOI of 10) and treated with medium (mock) or anti-E2 antibody (5 μg/mL) at 4 h after infection. Twenty-four hours after infection, total cellular RNA was reverse transcribed to cDNA for qRT-PCR analysis of nsP1 defective viral genome levels. (C) Primer design used for qRT-PCR assay. Primers for the nsP1 defective viral genome span the deleted SINV region, while primers for the SINV genomic RNA are within the deleted region. (D) qRT-PCR analysis for nsP1 defective genome production. nsP1 RNA levels are expressed as fold regulation relative to SINV gRNA as calculated by ddCT. Data are presented as mean ± SD from two biological replicates. (E) Immunoblot of SINV nsP1, nsP2, and nsP3 expression from untreated and antibody-treated SINV-infected dAP-7 cells. (F) Densitometry was used to determine the ratios of nsP1 to nsP2 in immunoblots and to compare untreated (TE) to antibody-treated (MAb) SINV-infected dAP-7 cells. *, P < 0.05.
