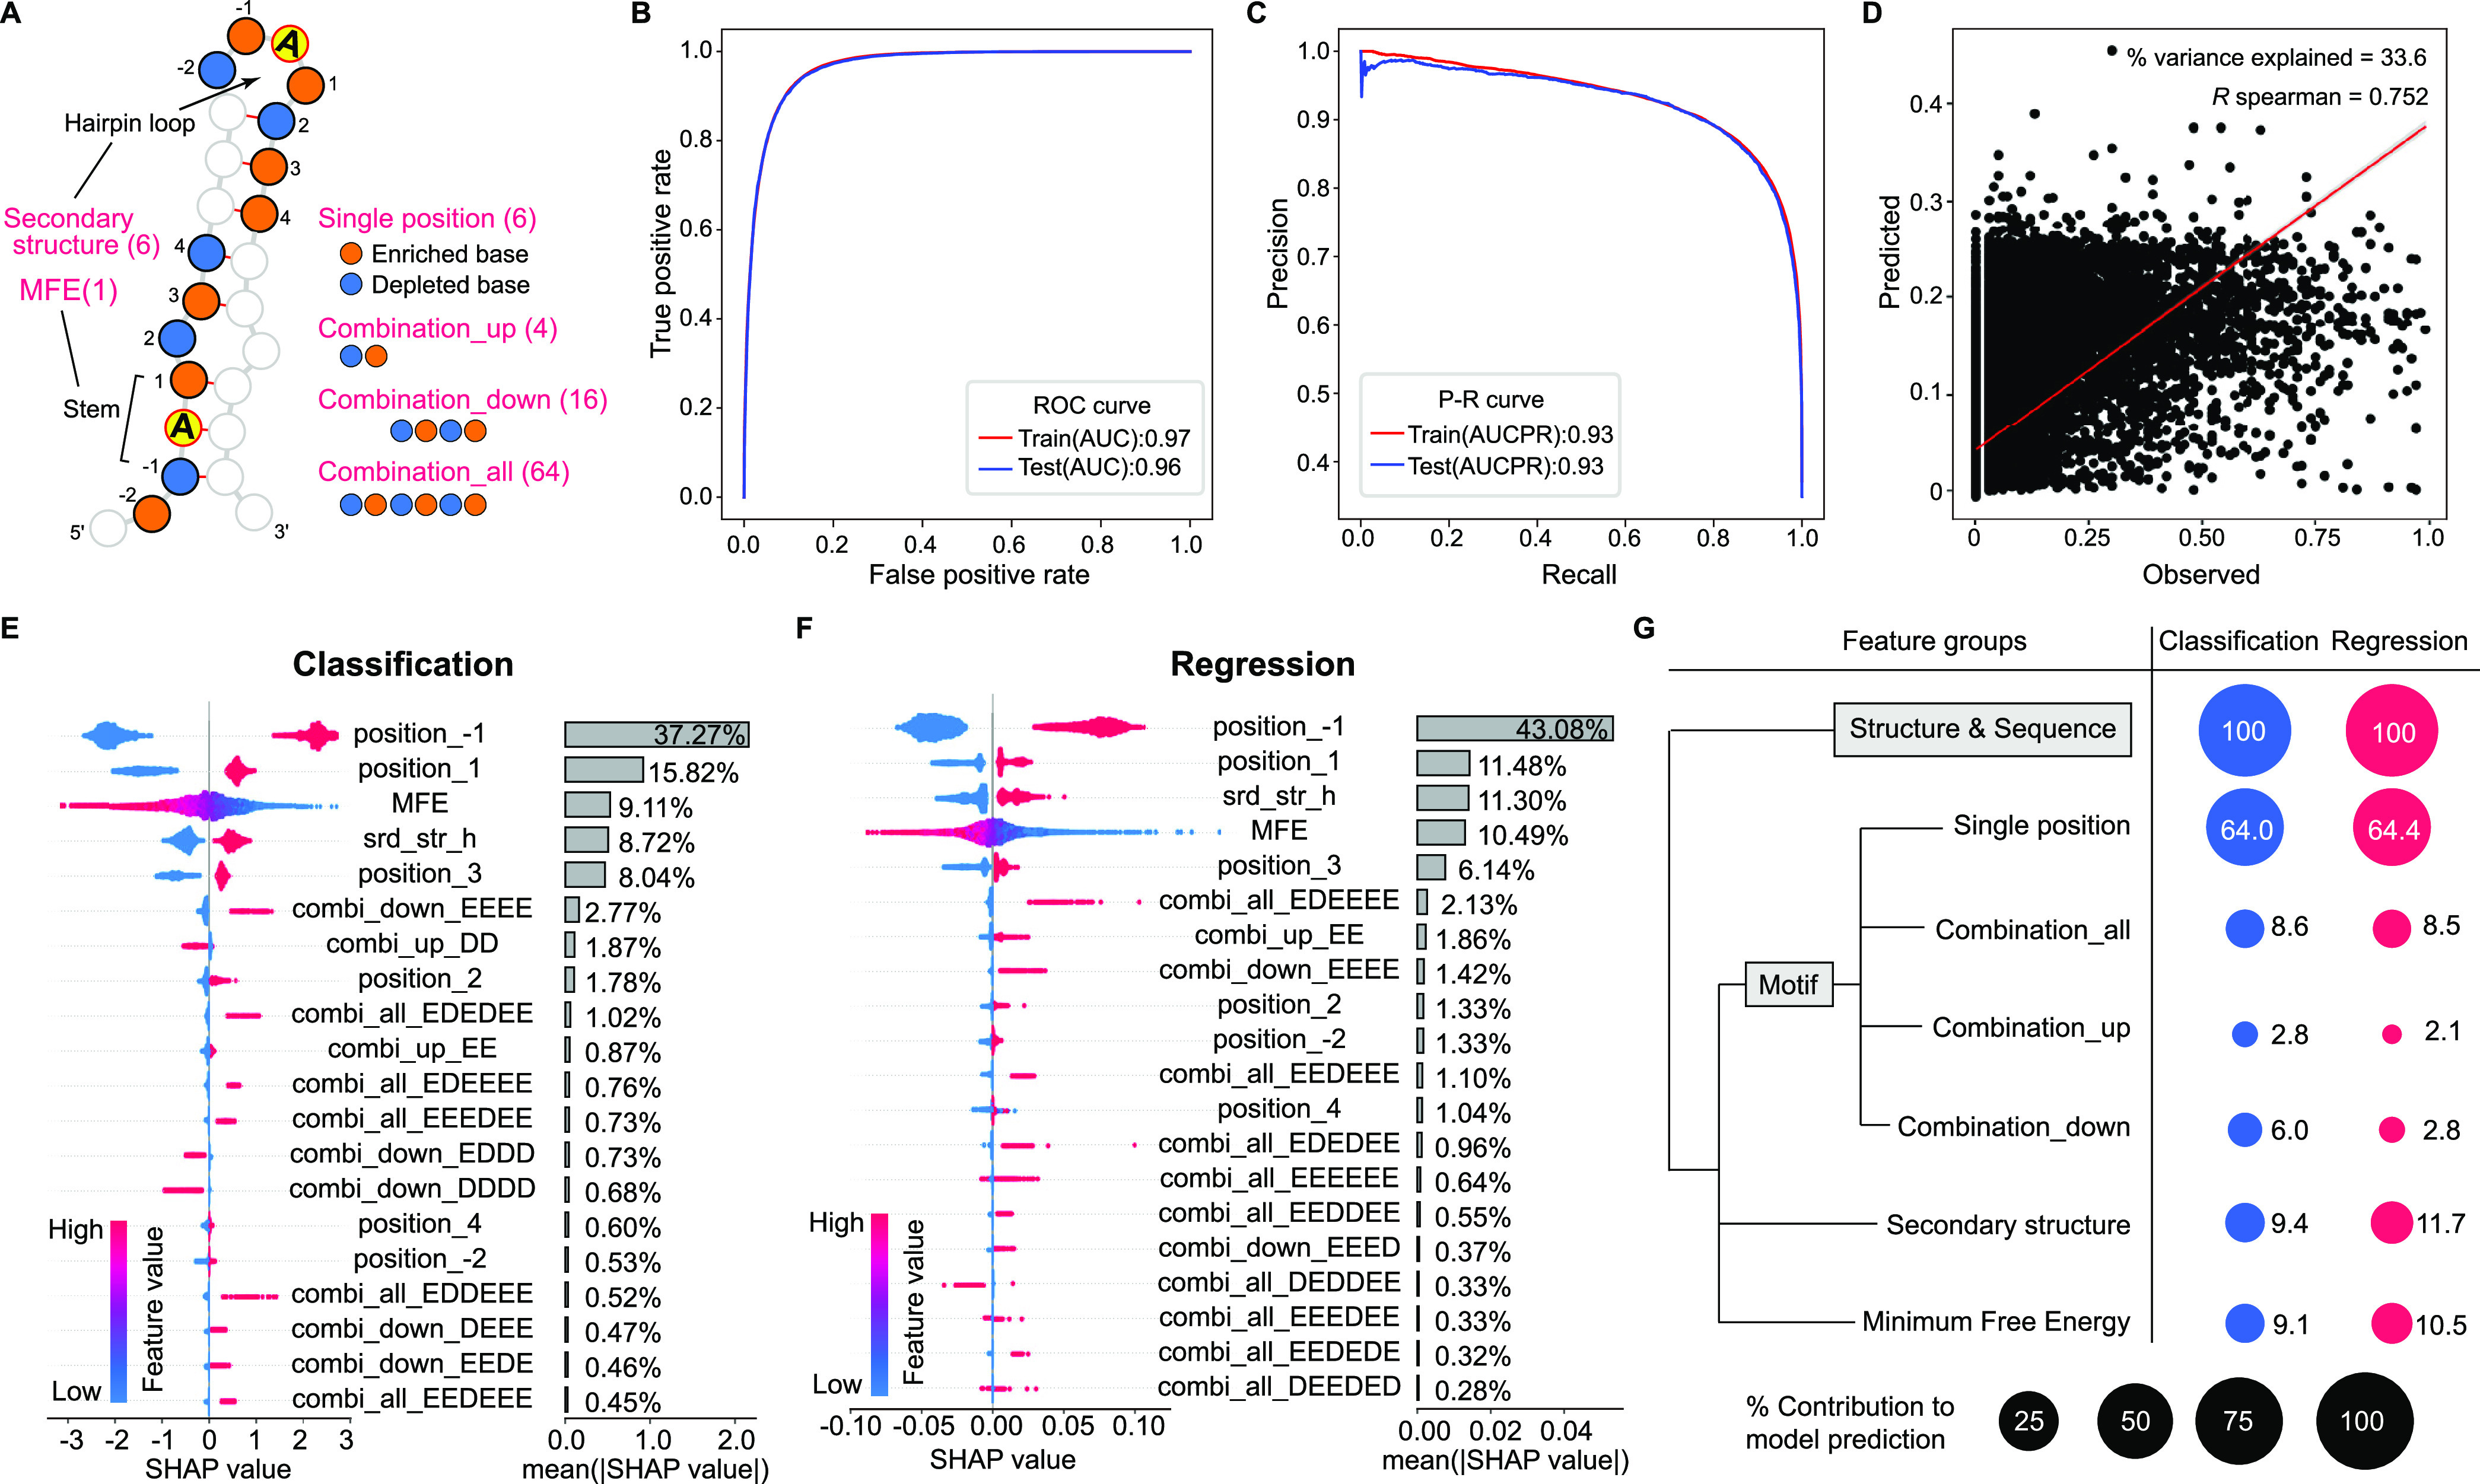
FIG 6.

Machine learning model predictions and quantitative contributions of cis-regulatory features to the model prediction. (A) Graphical representation of the RNA sequence and structural features of editing or non-editing A sites used for XGBoost analysis. The features are categorized into 6 groups (shown in red font). Numbers in parentheses indicate the number of features in each group. The individual features included in each feature group are listed in Table S4. (B) and (C) Receiver Operating Characteristic (ROC) (B) and Precision-Recall (P-R) (C) curves of the classification model prediction of RNA editing site using XGBoost in training data set and held-out test data set. AUC, Area under the ROC Curve; AUCPR, Area under the Precision-recall Curve. (D) Editing level predictions in held-out test data set using XGBoost with a regression model. R2 is a measure of the % variance explained. Spearman R indicates a correlation between observed and predicted editing levels. Error bands (in gray) the 95% pointwise confidence bound for the mean predicted value, using linear smoothing. (E) and (F) SHAP values for the 20 most important features driving XGBoost predictions with classification (E) and regression models (F). Each dot indicates a site in the held-out test data set and the dot color shows the SHAP value from high (red) to low (blue). Positive and negative SHAP values indicate the features that drive the prediction over and below the data set base value, respectively. Features are ranked from top (most significant) to bottom (least significant) by predictive importance. The percent contribution of individual features to model prediction is indicated. The capital letters “E” and “D” in the feature names represent the enriched and depleted nucleotides at −2 to +4 positions of editing sites. (G) Contributions of different feature groups to the prediction of editing sites (by classification model) and levels (by regression model). Black dots indicate the scale.
