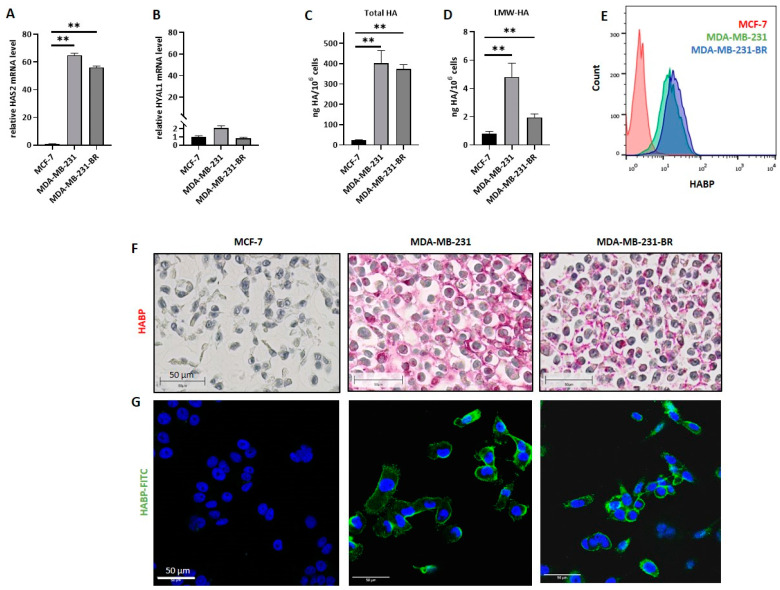
Figure 1.
Hyaluronan metabolism in breast cancer (BC) cell lines of different molecular subtypes. The relative mRNA expression level of (A) hyaluronan synthase 2 (HAS2) and (B) hyaluronidase 1 (HYAL1) was measured by qRT-PCR. Values are normalized to corresponding GAPDH expression (n = 3). (C) Bar graph displaying ELISA results on secreted hyaluronan (HA) levels (ng/106 cells) of MCF-7, MDA-MB-231, and MDA-MB-231-BR. Cell supernatant was collected and used for HA-ELISA; one representative experiment with three replicates out of three experiments is shown (n = 3). (D) Levels of secreted low-molecular-weight HA (LMW-HA) (ng/106 cells) of MCF-7, MDA-MB-231, and MDA-MB-231-BR measured by HA-ELISA; one representative experiment with duplicates out of three experiments is shown (n = 3). (E) Histogram showing the quantified amount of surface HA, measured via flow cytometry using biotinylated HA binding protein and FITC-conjugated Streptavidin. One representative experiment is shown (n = 3). (F) Immunohistochemical staining of HA (pink) using biotinylated HA binding protein of all three cell lines. Representative picture out of 3. Scale bars represent 50 µm. (G) Immunofluorescence staining of nuclei (DAPI, blue) and HA (FITC, green) using biotinylated HA binding protein and FITC-conjugated Streptavidin for all three cell lines. Representative picture out of 3. Scale bars represent 50 µm. Statistical significance was determined using unpaired two-tailed Student’s t-tests. The assumption of homogeneity of variance was tested using Levene’s Test of Equality of Variances (p > 0.05). Values are means +/− s.d., ** p < 0.005.

