Figure 6.
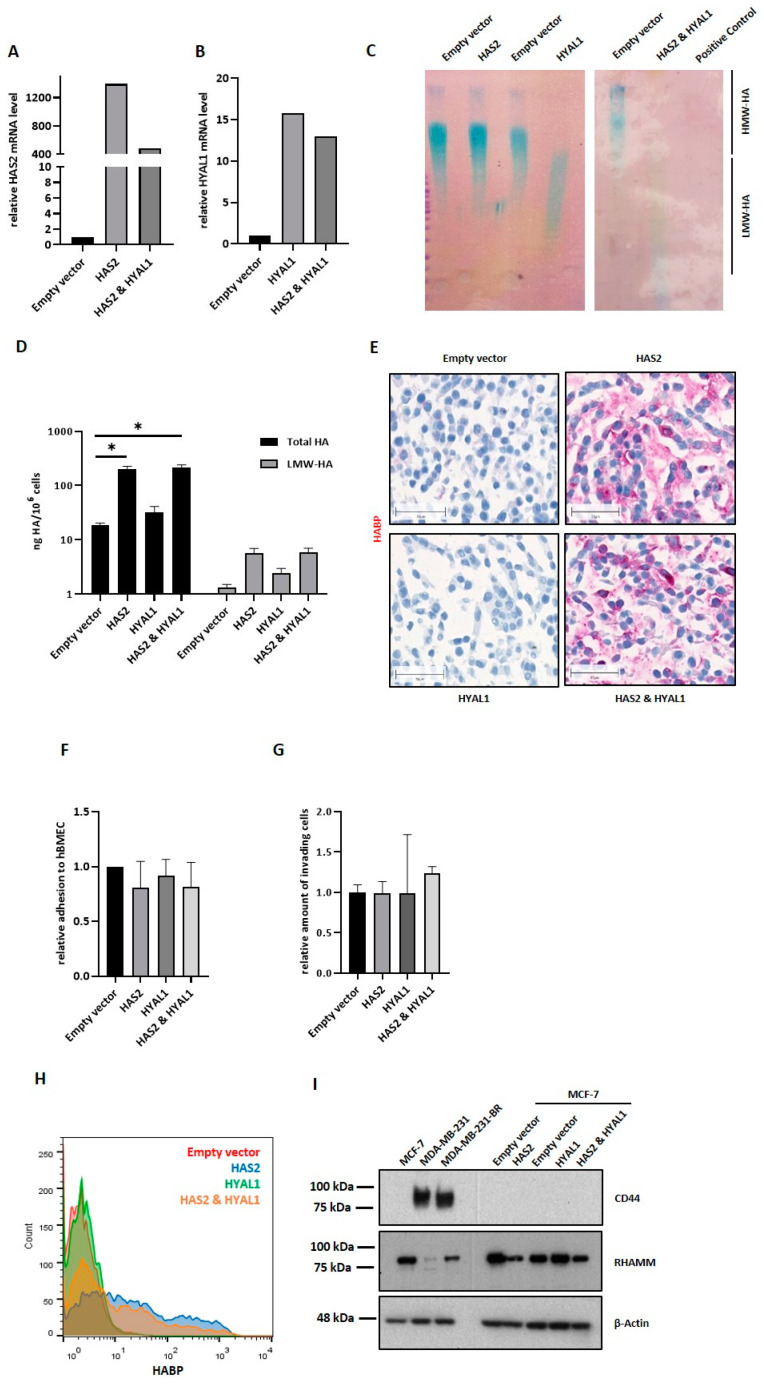
Impact of the HAS2/HYAL1 overexpression in MCF-7 cells on the interaction with the brain endothelium. Relative mRNA level of HAS2 (A) and HYAL1 (B) in MCF-7 control (empty vector), single overexpression (HAS2 or HYAL1), and double overexpression (HAS2 and HYAL1) measured by qRT-PCR. Values are normalized to corresponding GAPDH expression. (Representative; changed over time, but stable overexpression, n = 4). (C) HYAL1-activity gel-assay: HMW-HA (32 µg) was incubated for 14 h at 37 °C with 20 µg of protein lysate (RIPA (−/−)), obtained from different overexpressing MCF-7 cells and control cells. HMW-HA, incubated with 50 µL Hyaluronidase (1 mg/mL) served as a positive control. (D) Bar graph displaying HA-ELISA results on secreted total HA and LMW-HA levels (ng/106 cells) of MCF-7 control (Empty vector), single overexpression (HAS2, HYAL1), and double overexpression (HAS2 and HYAL1) cells. Cell supernatant was collected and used for HA-ELISA. (E) Histochemical staining of cells in agar using biotinylated HA-binding protein. Scale bars represent 50 µm. (F) Adhesion ability of MCF-7 control (empty vector), single overexpression (HAS2, HYAL1), and double overexpressing (HAS2 and HYAL1) cells to primary human brain endothelial cells (hBMECs) analyzed under static conditions. The relative amount (to empty vector = 1) of adhesive cells is shown (n = 5). (G) Invasion potential of MCF-7 control (empty vector), single overexpression (HAS2, HYAL1), and double overexpression (HAS2 and HYAL1) through hBMECs, measured in a transwell assay (representative experiment, n = 3). (H) Multilayer histogram showing the quantified amount of surface HA of MCF-7 control (empty vector), single overexpression (HAS2, HYAL1), and double overexpressing (HAS2 and HYAL1) cells measured via flow cytometry using biotinylated HA-binding protein and Cy5/FITC-conjugated Streptavidin. One representative experiment is shown (n = 3). (I) Representative Western blot (n = 2) result of protein lysates (20 µg) of MCF-7 control (empty vector), single overexpression (HAS2, HYAL1) and double overexpressing (HAS2 and HYAL1) cells showing expression of different HA receptors, CD44 and RHAMM. β-Actin was used as loading control. Statistical significance was determined using unpaired two-tailed Student’s t-tests. The assumption of homogeneity of variance was tested using Levene’s Test of Equality of Variances (p > 0.05). Values are means +/− s.d. * p < 0.05.

