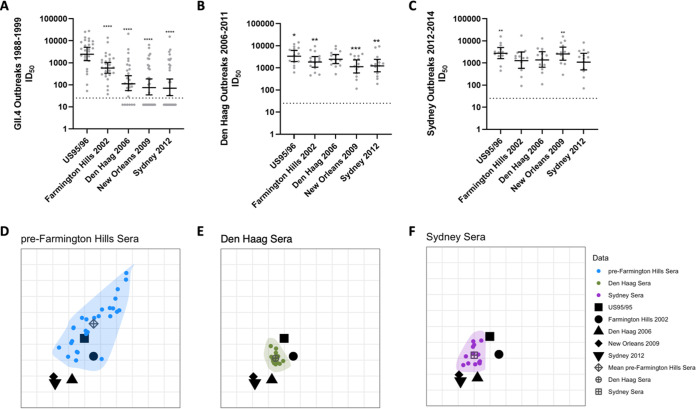
FIG 5.
Antigenic divergence measured by convalescent-phase outbreak sera. (A to C) Blockade antibody titer in adult sera collected from GII.4 norovirus outbreaks between 1988 and 1999 (n = 27) (A), Den Haag 2006 outbreaks in 2006 to 2011 (n = 14) (B), and Sydney outbreaks in 2012 to 2014 (n = 14) (C) were compared to time-ordered GII.4 variants. Marker, individual response. Line, geometric mean titer. Error bars, 95% confidence intervals. *, P ≤ 0.03; **, P ≤ 0.0021; ***, P ≤ 0.0002; ****, P < 0.0001, Wilcoxon matched-pairs signed-rank test, compared to US95/96 (A), Den Haag 2006 (B), or Sydney 2012 (C). (D to F) Antigenic cartography analysis across all serum sets, divided into separate panels for clarity: pre-Farmington Hills sera (D), Den Haag 2006 sera (E), or Sydney 2012 sera (F). Viral variants are represented as distinct black shapes, and each serological data set is represented by distinct colors and is encapsulated in a shaded polygon. The mean of the serological points for each serum set is indicated by distinct dark gray shapes. One grid box corresponds to a 2-fold change in titer. Note that the orientation of the plots does not matter.

