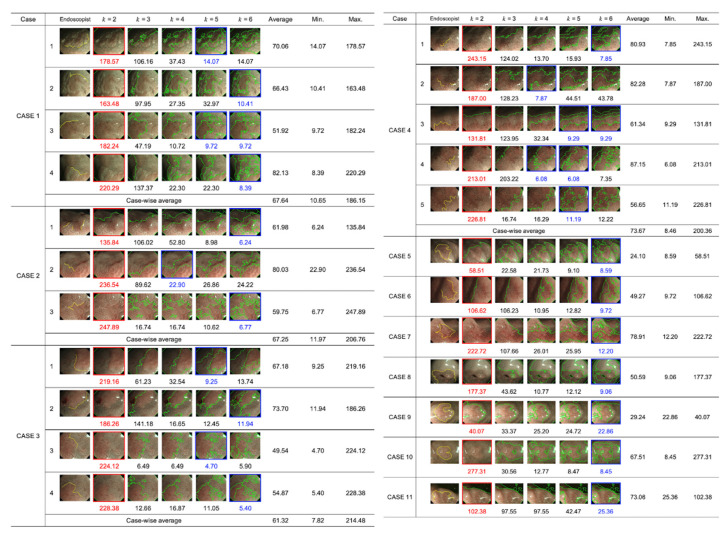
Figure 4.
DL candidates provided by the proposed method at different cluster number settings (k = 2, 3, 4, 5, and 6) for 23 M-NBI images obtained from 11 cases. The leftmost images present the DLs provided by the endoscopists. The Euclidean distance between the true DL and DL candidates provided by the proposed method is indicated below each image at different k values. The average, minimum, and maximum distances were calculated with different k settings for each case.

