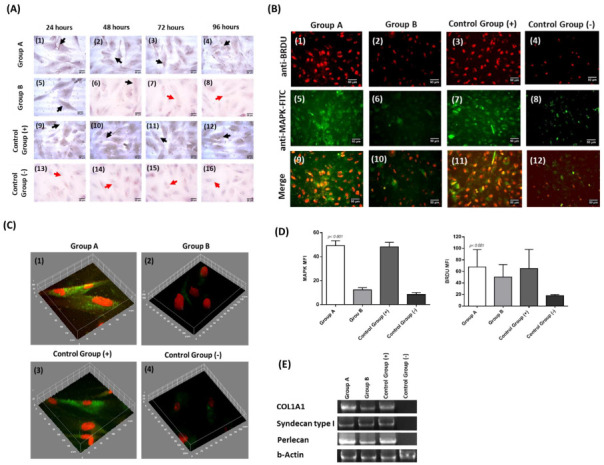
Figure 4.

Immunostaining and gene expression analysis of CECs. Immunohistochemistry against MAP kinase in CECs of all groups (A). Specifically, differences in MAP kinase expression levels were detected between groups A (A1–A4), group B (A5–A8), positive control group (A9–A12) and negative control group (A13–A16). Black and red arrows in images A1–A16 indicated the presence and absence of MAP kinase, respectively. All images were acquired with original magnification 40x and scale bars 25 μm. Performance of indirect immunofluorescence against MAP kinase in combination with BrdU in CECs (B). Indirect immunofluorescence against MAP kinase and BrdU in CECs of group A (B1, B5, B9), group B (B2, B6, B10), positive control group (B3, B7, B11), and negative control group (B4, B8, B12). All images were acquired with original magnification 20× and scale bars 50 μm. 3D reconstruction models of CECs obtained from the indirect immunofluorescence against MAP kinase and BrdU (C). 3D reconstruction images of CECs from group A (C1), group B (C2), positive control group (C3), and negative control group (C4). Mean fluorescence intensity of MAP kinase and BrdU of CECs from all study groups (D). Molecular analysis and detection of Col1A1, Syndecan type 1, Perlecan and b-actin of CECs from all study groups (E). Group A: CECs cultured with α-ΜΕΜ supplemented with 20% v/v CB-PL), Group B: CECs cultured with α-ΜΕΜ supplemented with 20% v/v CB-PPP, control group (+): positive control group, CECs cultured with complete culture medium, control group (−), negative control group: CECs cultured only with α-MEM.
