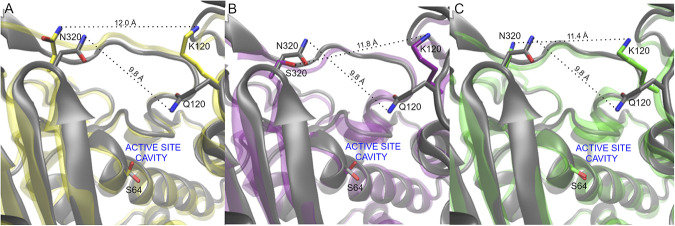
FIG 5.
Comparison of representative snapshots of the MD simulations of each protein studied compared to PDC-3 showing the active site cavity environment (R1 region). In all representations, N atoms are depicted in blue, O atoms are depicted in red, and key residues are highlighted in sticks. C atoms of the PDC-3 are depicted in gray. (A) PDC-3 versus PDC-461 (C atoms in yellow); (B) PDC-3 versus PDC-462 (C atoms in purple); (C) PDC-3 versus PDC-463 (C atoms in green). Residue distances are depicted with dashed lines.

