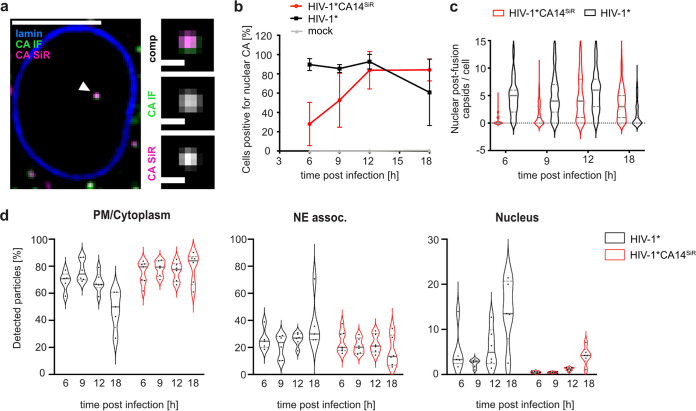
FIG 4.
Detection of CA in the nucleus of infected HeLa-derived cells. TZM-bl cells were infected with HIV-1* or HIV-1* CA14SiR particles (~MOI, 0.8), treated with 15 μM PF74 for 1 h before fixation, fixed at 6, 9, 12, and 18 h p.i. and imaged by SDCM. (a) Single z slice of a representative cell infected with HIV-1* CA14SiR at 18 h p.i. and one enlarged z slice are shown. Scale bars: 10 μm (cell) and 1 μm (enlargement). Mean filter and background subtraction was applied for clarity. The image shows a representative image from one of three independent experiments. See Fig. S5 for additional data. (b to d) Infection time course of click-labeled HIV-1* CA14SiR compared to HIV-1*. Quantification of cells containing nuclear CA-positive objects at the indicated times postinfection for HIV-1* [black; CA(IF)], HIV-1* CA14SiR [red; CA(IF)/CA(SiR)] and noninfected control ]gray; CA(IF)]. Mean values and SD from three independent experiments are shown (n > 115 cells per time point). (c) Number of nuclear CA foci per cell determined for cells infected with HIV-1* (black) or HIV-1* CA14SiR (red) at the indicated time points; n > 120 cells were analyzed per sample. The median and interquartile lines are indicated in gray. (d) Localization of particles within the cell for HIV-1* (black) and HIV-1* CA14SiR (red). The proportion of total particles per cell detected at the PM or in the cytoplasm (PM/cytoplasm) at the nuclear envelope (NE assoc.) or inside the nucleus was determined at the indicated time points. Data from two of three independent experiments are shown. Graphs show median of analyzed field of views in red (n > 20 cells per condition) and interquartile lines.

