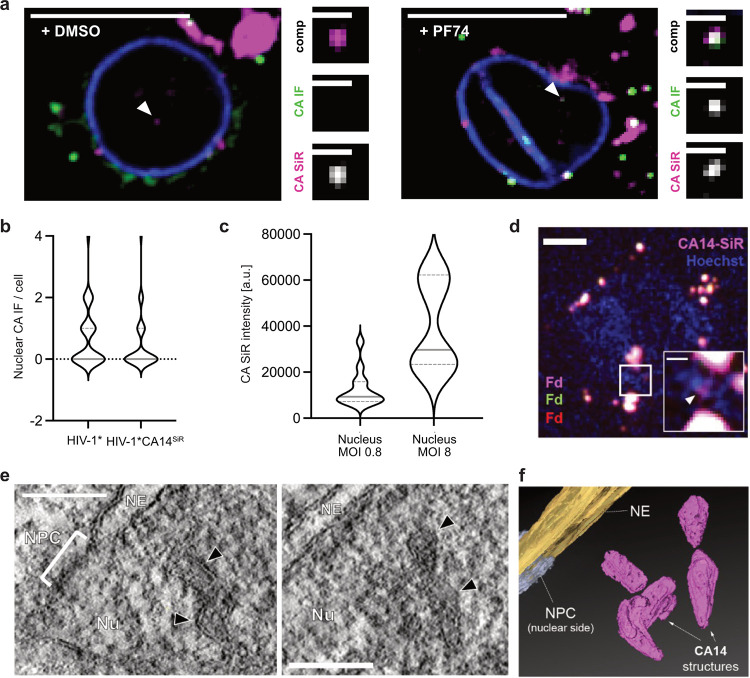
FIG 7.
Largely complete click-labeled capsid structures detected in the nucleus of primary CD4+ T cells and T cell line. (a) Activated CD4+ T cells were infected with HIV-1*CA14SiR (MOI, ~0.8), treated with DMSO/PF74 treatment for 1 h before fixation at 24 h p.i., and extracted with methanol. Samples were immunostained against CA (green) and lamin A/C (blue). Images show a single z slice through the cell. Enlargements show the particle marked by the arrowhead. Scale bars: 10 μm (overview) and 1 μm (enlargement). (b) Data analyzed from the experiment outlined in (a). The graph shows the number of CA-positive foci per nucleus in cells infected with HIV-1* (n = 35 cells, mean = 0.85) or HIV-1*CA14SiR (n = 73 cells, mean = 0.51). Pooled data from 6 different blood donors are shown. Gray lines show median and interquartile lines. (c) CA(SiR) intensities of nuclear objects in infected and activated CD4+ T cells at an MOI~0.8 (n = 13; mean = 12,485 ± 7,445 AU) and an MOI of ~8 (n = 7; mean = 39,502 ± 18,025 AU). MOI was determined in TZM-bl cells. Gray lines show median and interquartile lines. (d to f) Nuclear cone-shaped capsids detected by CLEM-ET. SupT1 cells were treated with 1 μM aphidicolin (APC) for 16 h to prevent cell division, before infection with HIV-1*CA14SiR virions (2.3 μU RT/cell, corresponds to an MOI of ~0.4 determined in TZM-bl cells). At 24 h p.i., cells were cryoimmobilized by high-pressure freezing, freeze substituted, and further processed for CLEM and ET as described in Materials and Methods. (d) SDCM image of a 250-nm-thick resin section of the cell infected with HIV-1*CA14SiR virions (magenta), poststained with Hoechst (blue) and decorated with multi-fluorescent fiducials (Fd) for correlation. The arrowhead in the enlargement of the boxed region indicates a CA(SiR) signal within the Hoechst-stained nuclear region. Scale bars = 1 μm (overview) and 200 nm (enlargement). (e) Computational slices through tomographic reconstructions at the correlated region boxed in panel d with views highlighting the presence of clustered capsid-reminiscent structures (black arrowheads) in the nuclear region. Nu, nucleus; NPC, nuclear pore complex; NE, nuclear envelope. Scale bar = 100 nm. (f) Segmented and isosurface rendered structure of the cones detected in panel e. Magenta: capsid; yellow: NE; cyan: NPC (cryo-EM map of NPC: EMD-11967 [16]). See also Movie S1.

