Figure 2.
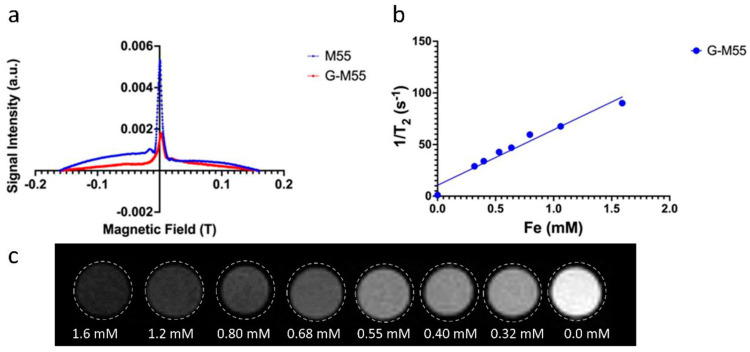
Characterization of G-M55 as a bimodal contrast agent. (a) Relaxometry measurement of naked (M55; blue line) and coated (G-M55; red line) nanoparticles, through the MPI RELAX module. This measurement enabled quantification of signal efficiency and of the resolution given by the tracer. (b) Plot of transverse relaxation rate (1/T2) vs. Fe concentration in water-dispersed G-M55 phantoms, at 25 °C. The slope of the fitting straight line (53.20 mM−1s−1) represents the transverse relaxivity coefficient (r2). (c) T2w MR images of phantoms, containing decreasing concentrations of G-M55.

