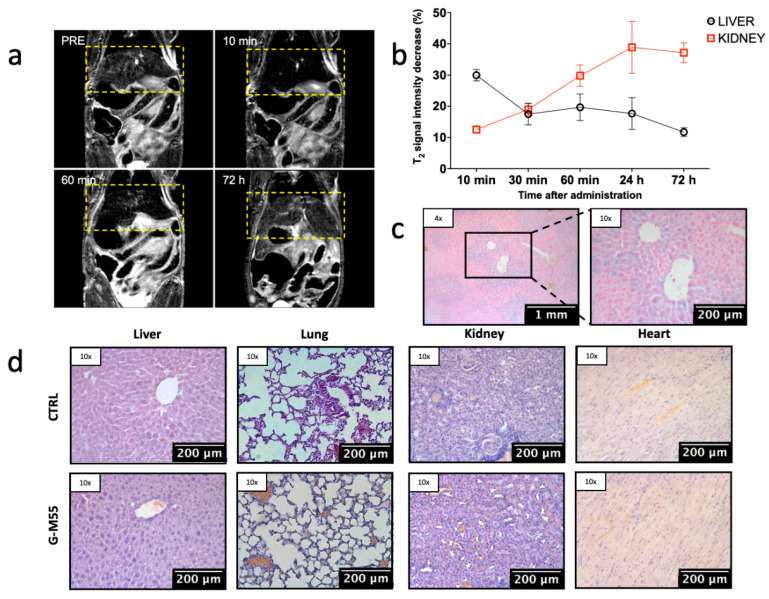
Figure 5.
Biodistribution and clearance of G-M55. (a) Representative T2w MR images of murine body, acquired basally, and 10 min, 60 min, and 72 h after injection of G-M55. (b) Percentage average decrease of SI in liver and kidney at different time points. (c) Prussian blue staining of liver tissue, excised 72 h after G-M55 injection. (d) Histological slices of main organs, stained with H&E obtained from a representative mouse administered with G-M55 vs. control.

