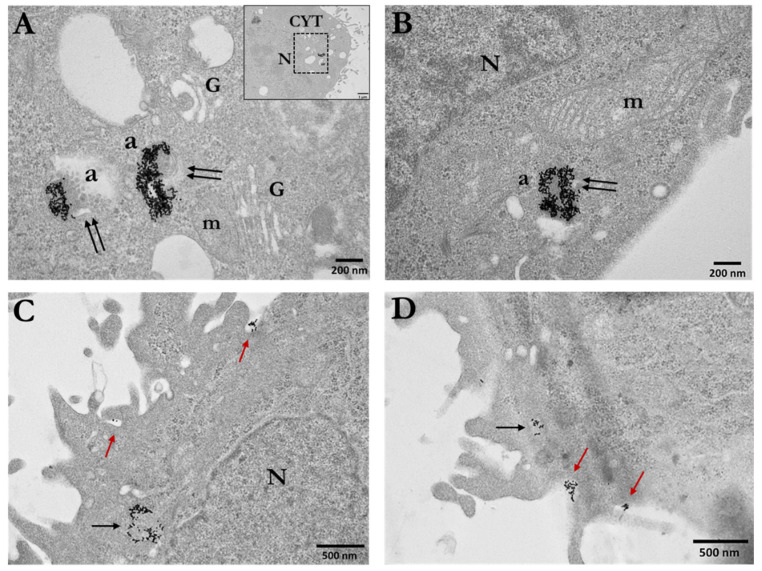
Figure 3.
Electron micrographs of PC3 cells incubated for 24 h with 15 nm Ct-AuNPs (30 μg/mL). (A,B) Images show the distribution and localization of Ct-AuNPs in different cells. NPs were located in autophagosomes or autolysosomes (double arrows). (C,D) Nanoparticles were seen located in the cytoplasm and in vesicles (black single arrows). Red arrows indicate the mechanism by which the cell may internalize AuNPs via endocytosis. N: nucleus, m: mitochondrion, a: autophagosome/autolysosome, G: Golgi apparatus, CYT: cytoplasm. The box with dotted line in the inset of (A) indicates the area of the cell depicted in the main figure at higher magnification.

