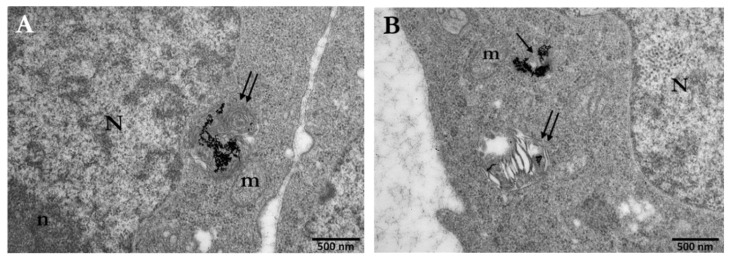
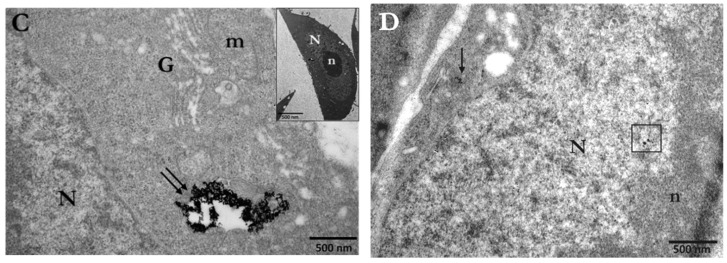
Figure 5.
Electron micrographs of PC3 cells incubated for 24 h with 5 nm PEG-AuNPs (30 μg/mL). (A) Image depicts the accumulation of PEG-AuNPs inside an autophagosome (double arrows), which is located right next to the nuclear envelope. (B) Image depicts the localization of PEG-AuNPs in the cytoplasm (single arrows) and inside an autophagosome (double arrows) that seems to have also taken up a damaged mitochondrion. (C) Numerous PEG-AuNPs are located inside an autophagosome (double arrows). (D) Image depicts the localization of a few 5 nm PEG-AuNPs inside the nucleus (black box). N: nucleus, n: nucleolus, m: mitochondrion, G: Golgi apparatus. Scale bars = 500 nm.


