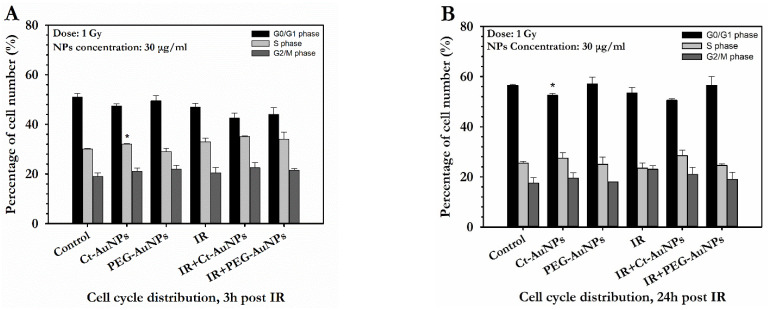
Figure 11.
Flow cytometry analysis of cell cycle phase distribution of A549 cells in dependence of the irradiation and AuNP treatment (30 μg/mL). (A) Cell cycle distribution 3 h after 1 Gy of IR exposure. Cells were treated with AuNPs for 24 h, irradiated and collected 3 h after exposure. (B) Cell cycle distribution 24 h after 1 Gy of IR exposure. Cells were treated with AuNPs for 24 h, irradiated and collected 24 h after exposure. Statistical significance was determined using Student t test: * p ≤ 0.05. Non-irradiated groups with AuNPs were compared with the control group to evaluate statistical significance whereas irradiated groups with AuNPs were compared with the radiation alone group.

