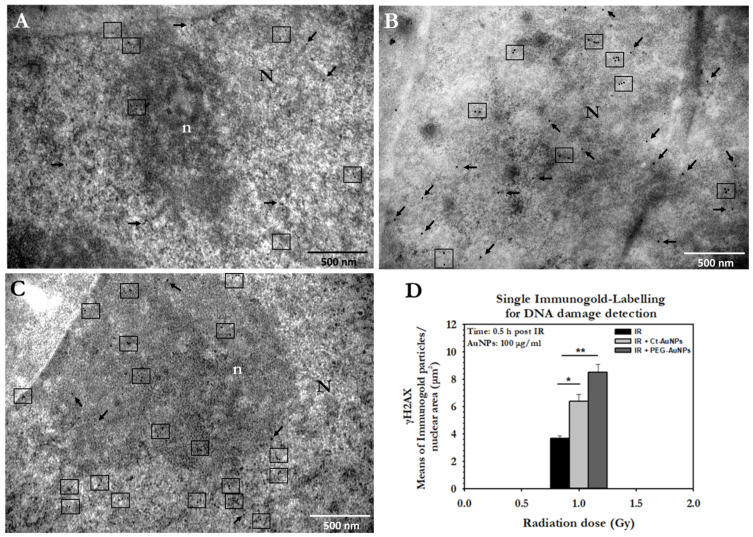
Figure 13.
Representative electron micrographs and quantification of single immunolocalization in PC3 cells for γH2AX detection inside the nucleus, 0.5 h after 1 Gy of IR exposure. (A) Image depicts the detection of γH2AX after irradiation, but without treatment with AuNPs. (B) Image depicts the detection of γH2AX after gold-nanoparticle-induced radiosensitization with 100 μg/mL Ct-AuNPs (15 nm). (C) Image depicts the detection of γH2AX after gold-nanoparticle-induced radiosensitization with 100 μg/mL PEG-AuNPs (5 nm). N: nucleus, n: nucleolus. Arrows in each image indicate γH2AX single immunogold particles and boxes are γH2AX clusters, the formation of which was increased after treatment with gold nanoparticles, compared to the irradiated-only cells. Scale bars = 500 nm. (D) Number of DSBs induced by 1 Gy X-rays in PC3 cells, both with and without treatment with AuNPs. γH2AX marker was used for the detection of DSBs and analysis was performed by TEM analysis and Image J. Results indicate mean number of γH2AX particles per nuclear area μm2. Statistical significance was determined using Student t test: * p ≤ 0.05, ** p ≤ 0.01.

