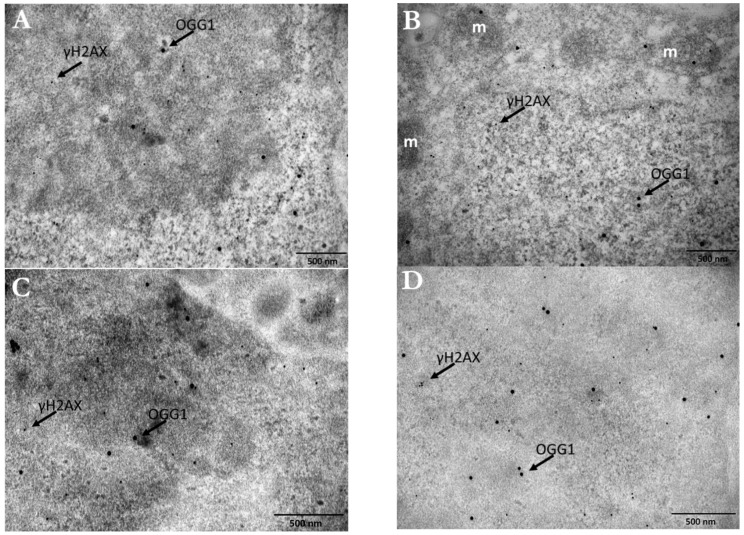
Figure 14.
Electron micrographs of PC3 cells after immunogold labelling for DSBs and oxidative lesion detection. Images represent double immunolocalization for γH2AX and OGG1 detection inside the nucleus, 0.5 h after 1Gy of IR exposure. The size of immunogold particles used for γH2AX and OGG1 was 10 nm and 25 nm, respectively. Arrows in each image indicate the γH2AX and OGG1 particles. (A,B) Images depict the detection of γH2AX and OGG1 after irradiation but without treatment with AuNPs. m: mitochondrion. (C,D) Images depict the detection of γH2AX and OGG1 after induced radiosensitization with 100 μg/mL Ct-AuNPs (15 nm).

