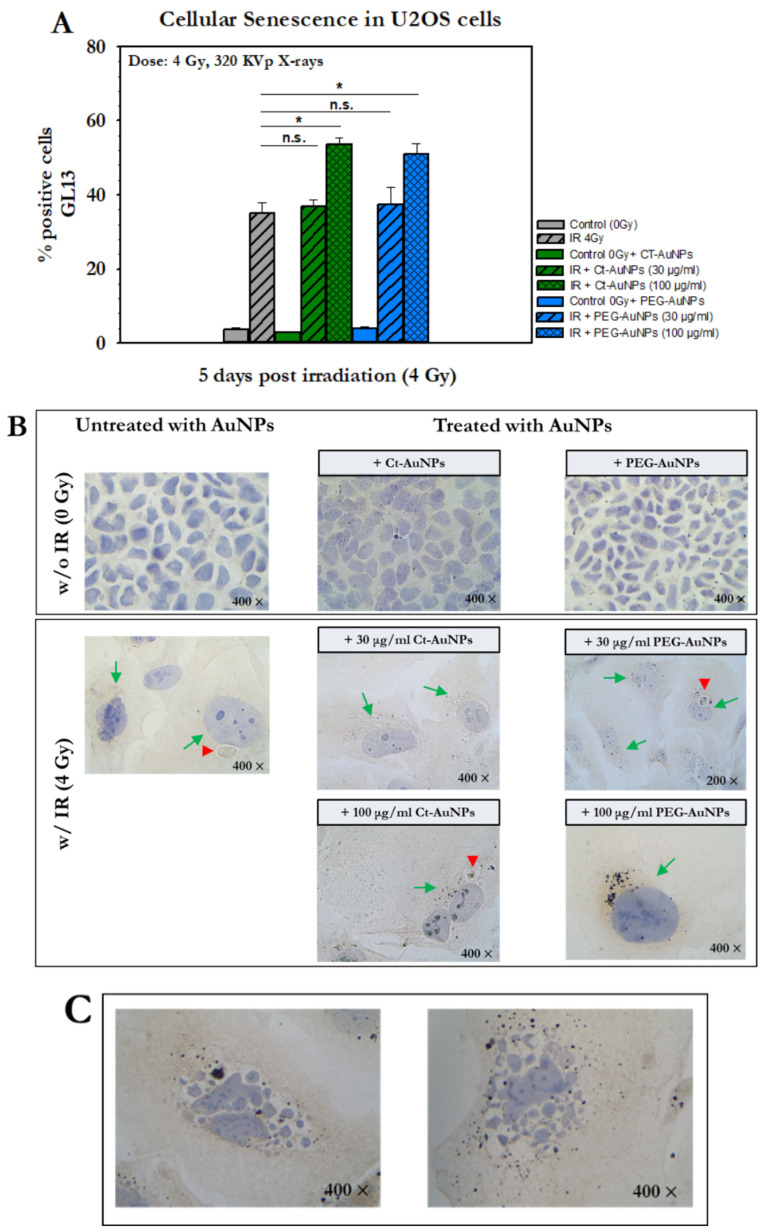
Figure 16.
Identification of senescence in U2OS cells after treatment with AuNPs and exposure to 4 Gy, 320 KVp X-rays. (A) Histograms represent the mean levels of cellular senescence in each group. Statistical significance between irradiated cells with or without treatment with AuNPs was determined using Student t test: * p ≤ 0.05, n.s.: not significant. (B) Images represent each group with or without exposure to IR after or not the treatment with different concentrations of either 15 nm Ct-AuNPs or 5 nm PEG-AuNPs. Cells were incubated at 37 °C for 5 days after radiation exposure. Green arrows indicate senescent cells and red arrows indicate perinuclear structures of GL13 staining. Original magnifications: 200×, 400×. (C) Indication of increased fragmented nuclei after exposure to 4 Gy X-rays and after staining with GL13. This phenotype was more prominent in cells treated with 100 μg/mL PEG-AuNPs (5 nm) before exposure to ionizing radiation.

