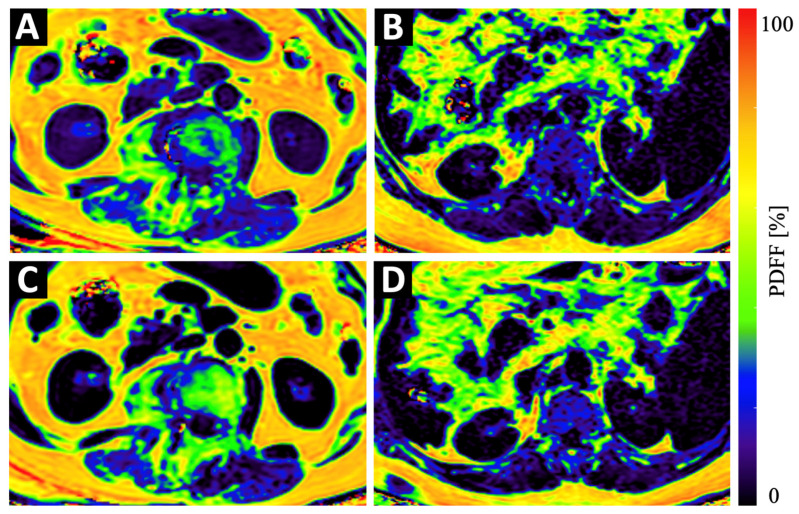
Figure 3.
Example color-coded PDFF maps of a 84-year old osteopenic (BMD = 107 mg/cm3) female patient (A,C) and a 69-year old male patient with normal BMD values (123 mg/cm3) (B,D) at baseline (A,B) and 6 months follow-up (C,D). Although the maps of the osteopenic patient (A,C) show a strong increase in PDFF in vertebral bone and in the PSM, the increase in the maps of the non-osteopenic/osteoporotic patient (B,D) show only a very subtle increase in PDFF.

