
FIG 4.
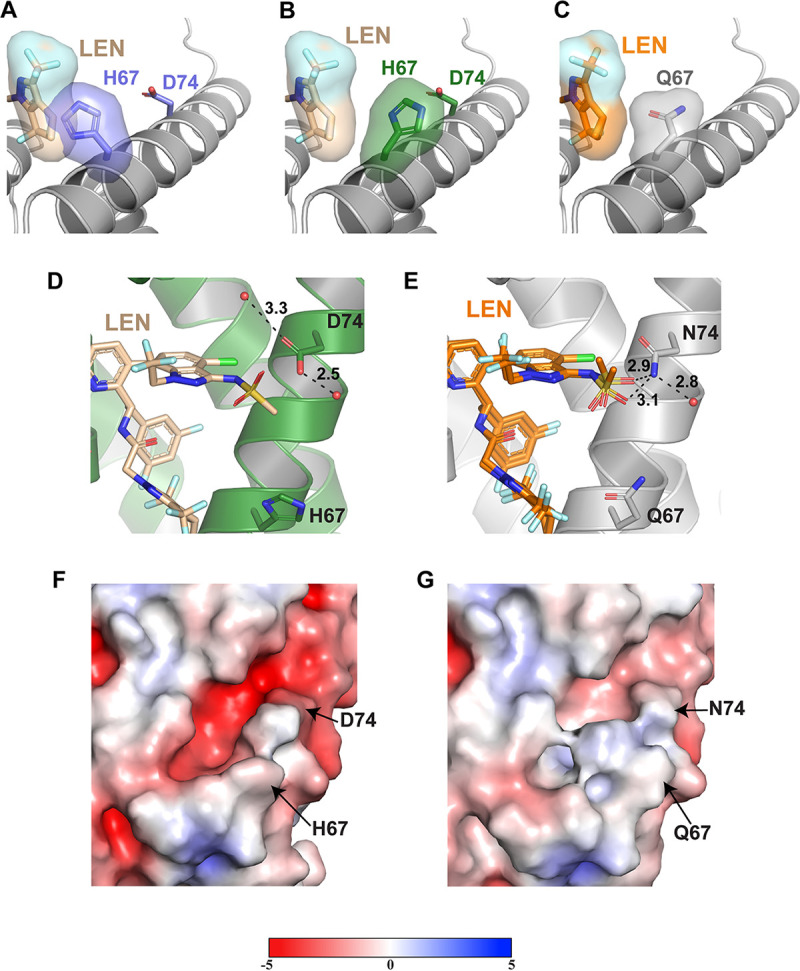
Structural basis for the LEN resistance of the CA(Q67H/N74D) hexamer. (A) X-ray crystal structure of the apo CA(Q67H/N74D) hexamer (slate purple; PDB: 7RHM) superimposed onto the CA(Q67H/N74D) + LEN (not shown + wheat) crystal structure with surface renderings of LEN and His67 to demonstrate how they would potentially interact. The darkened/shadowed surface rendering denotes an overlap in the space occupied by His67 and LEN. Cartoon regions are shown in light gray to highlight the substituted residue and LEN. (B) X-ray crystal structure of CA(Q67H/N74D) + LEN (forest green + wheat) with surface renderings of LEN and His67 to demonstrate their interaction. (C) Crystal structure of CA + LEN (light gray + orange; PDB: 6VKV) with surface renderings of LEN and Gln67 to demonstrate how they interact. (D) X-ray crystal structure of the prestabilized CA(Q67H/N74D) hexamer + LEN (forest green + wheat; PDB: 7RJ2), illustrating the lack of interactions between LEN and residue Asp74. (E) X-ray crystal structure of CA + LEN (light gray + orange; PDB: 6VKV) denoting the hydrogen bonding interaction between LEN and residue N74. Hydrogen bonding interactions are denoted by black dashed lines, and respective distances are indicated. (F and G) Surface renderings of the CA1-NTD for CA(Q67H/N74D) (PDB: 7RHM) and CA(WT) (PDB: 3H47), respectively, with the surface potential ranging from −5 to +5. Negatively charged regions are shown in red, and positively charged regions are shown in blue. Potentials were generated via the PDB2PQR server, and the surface was rendered using the adaptive Poisson-Boltzmann solver (APBS).