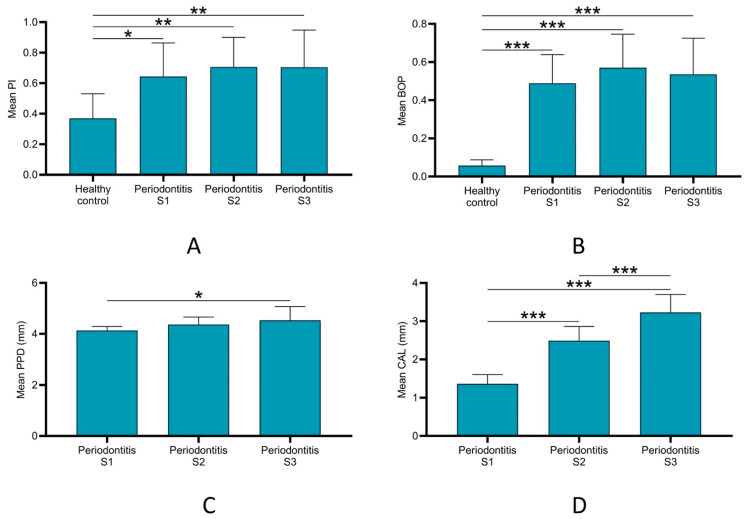
Figure 2.
Comparison of clinical parameters among all groups. (A) Mean plaque index (PI): periodontitis (S1 to S3) groups exhibited significantly higher PI than control group. (B) Mean bleeding on probing (BOP) scores: periodontitis (S1 to S3) groups exhibited significantly higher BOP than control group. (C) Mean probing pocket depth (PPD): periodontitis S3 showed significantly higher PPD than periodontitis S1 group. (D) Mean clinical attachment loss (CAL): periodontitis S3 showed significantly higher CAL than periodontitis S1 and S2 groups. CAL of periodontitis S2 was significantly higher than in periodontitis S1 group. * p < 0.03, ** p < 0.01, *** p < 0.001. S: stage.

