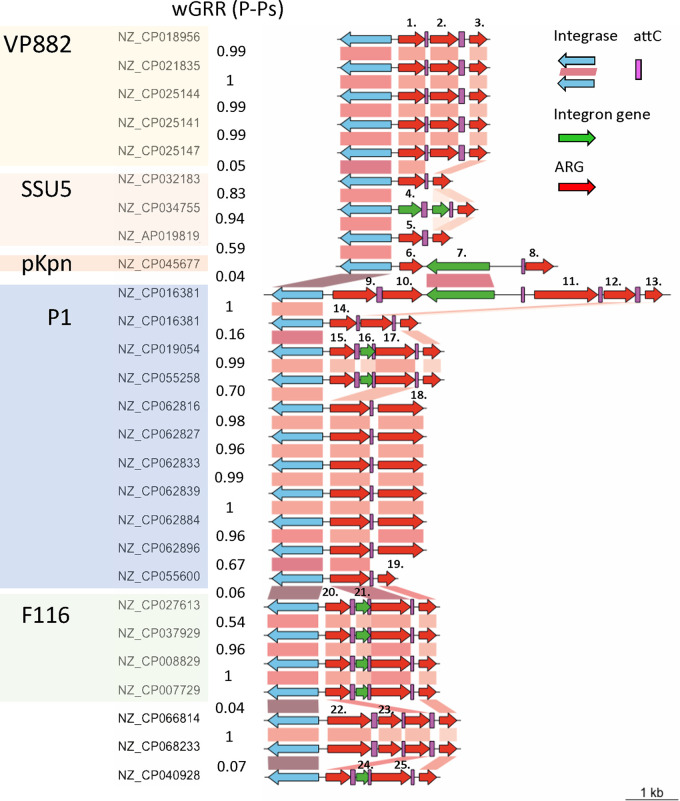
FIG 3.
Integrons encoded in P-Ps. Genomic organization of integrons found in P-Ps, arranged by P-P groups and coaligned by the class I Intl1 integrase. The P-P type is highlighted by different colors. Gene-to-gene assignment is based on a BLASTP comparison when the alignment is at least 90% identical and covers at least 90% of the sequences. Blue gene arrows indicate the integrase genes, red arrows show the AMR genes (99% identity with 99% coverage to reference sequences), and green arrows represent the rest of the genes within the integrons. Numbers indicated above nonhomologous cassettes represent different types of ARGs: (1,14): ant(2′')-Ia; (2): aac(6′)-33; (3;13;19): qacEΔ1; (4): aac(3)-Ib; (5): dfrA15; (6): arr-2; (7): group II intron reverse transcriptase/maturase; (8): aac(6′)-Ib; (9): blaCARB-2; (10;17;25): aadA2; (11): cmlA6; (12): catB11; (15;20): dfrA12; (16;21;24): DUF1010 protein; (18): aac(3)-VIa; (22): blaGES-1; (23): arr-6.

