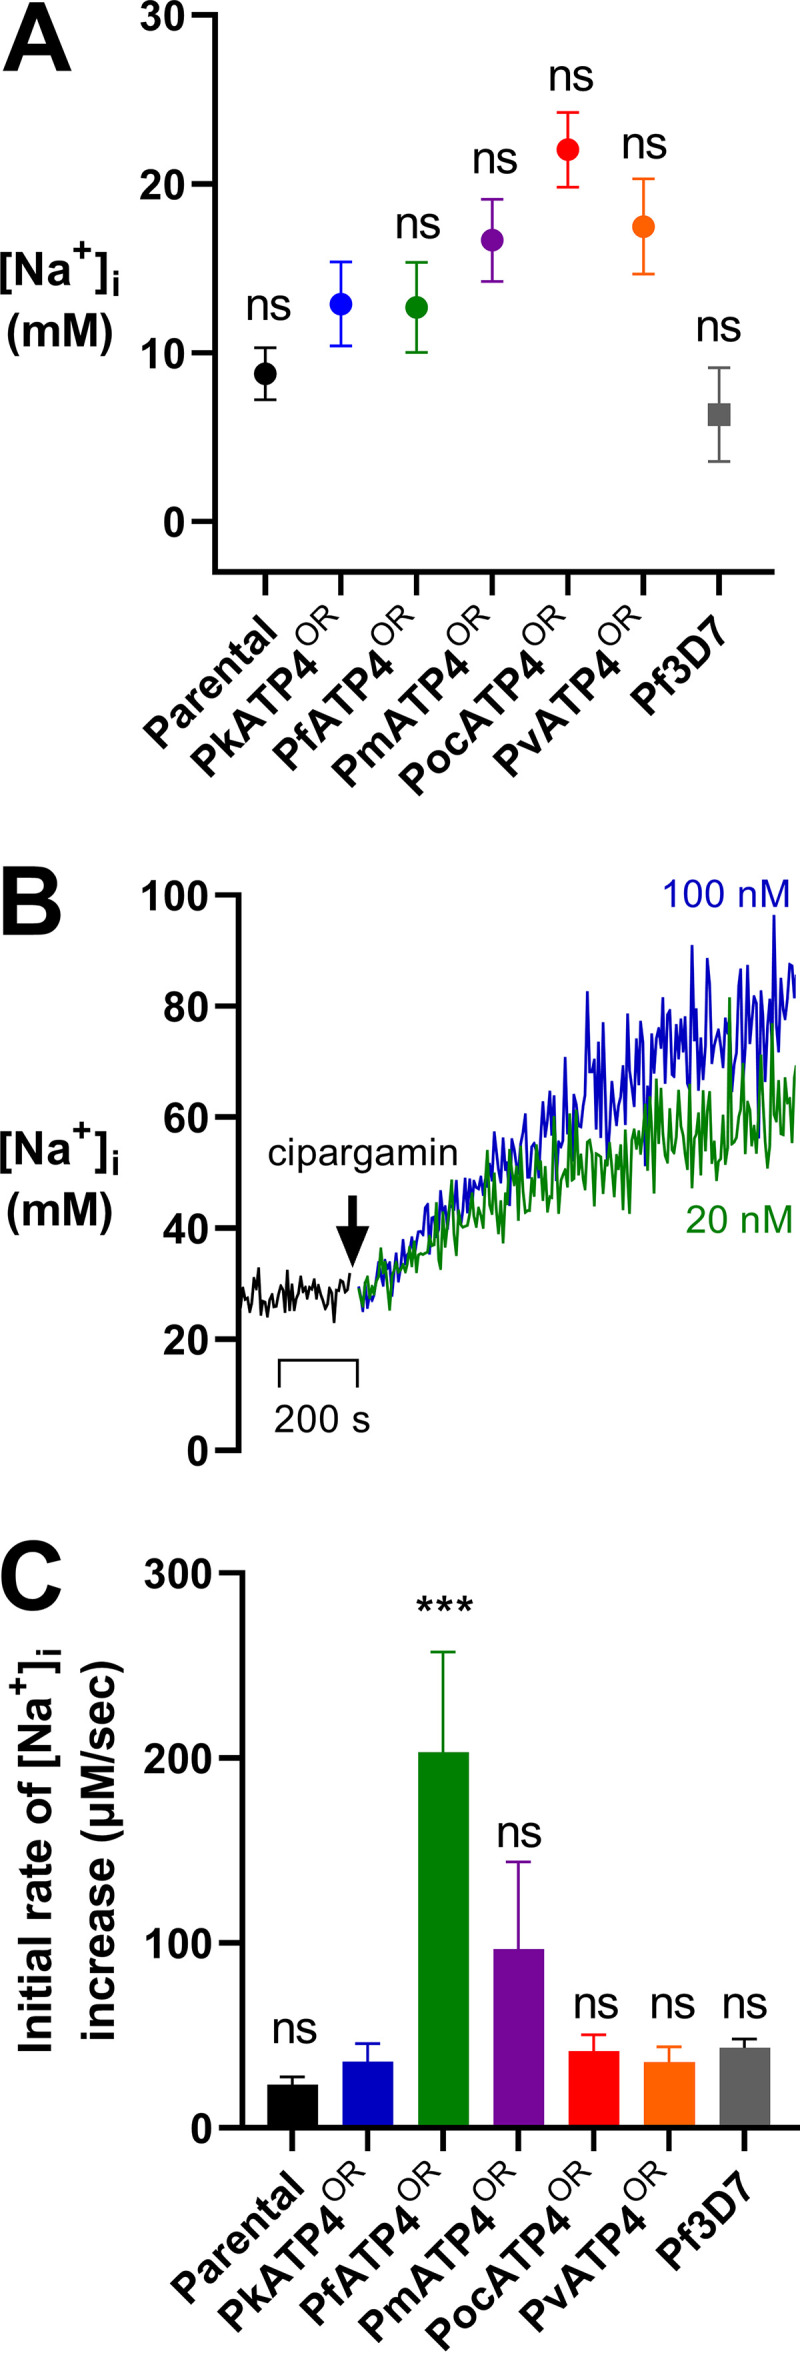
FIG 3.

Resting intracellular sodium concentration ([Na+]i) of the orthologue replacement lines and the concentration-dependent increase in [Na+]i after addition of cipargamin. Trophozoite-stage parasites were loaded with the Na+-sensitive fluorophore SBFI, and the fluorescence of the suspensions was measured in a spectrophotometer. (A) Measurements of resting [Na+]i show values of between 6.34 mM for the P. falciparum 3D7 line (gray square) and 22.03 mM for the PocATP4OR line (red circle). However, there was no significant difference for any of the lines compared to the PfATP4OR line (green circle; P > 0.0681). Data show the mean ± SEM. (B) Addition of cipargamin resulted in an immediate dose-dependent increase in the resting [Na+]i inside all parasite lines. Shown here are representative traces from a single experiment demonstrating the impact of adding 20 nM cipargamin (green trace) or 100 nM cipargamin (blue trace) on the resting [Na+]i of the PocATP4OR line. (C) Addition of 100 nM cipargamin to the parasite lines results in an increase in the [Na+]i from steady state. We determined the initial rate of increase in the [Na+]i by fitting a linear regression curve to the [Na+]i increase data across that 10-min exposure. The slope of that curve provides the rate of increase (in micromolar concentration per second). Experiments for resting [Na+] were performed in technical duplicates for at least three biological repeats, but some were performed to eight times. Experiments for the initial rate of increase in [Na+] were performed in technical duplicates for at least three biological repeats, but some were performed up to five times. ***, P ≤ 0.001; ns, non significant (P > 0.05).
