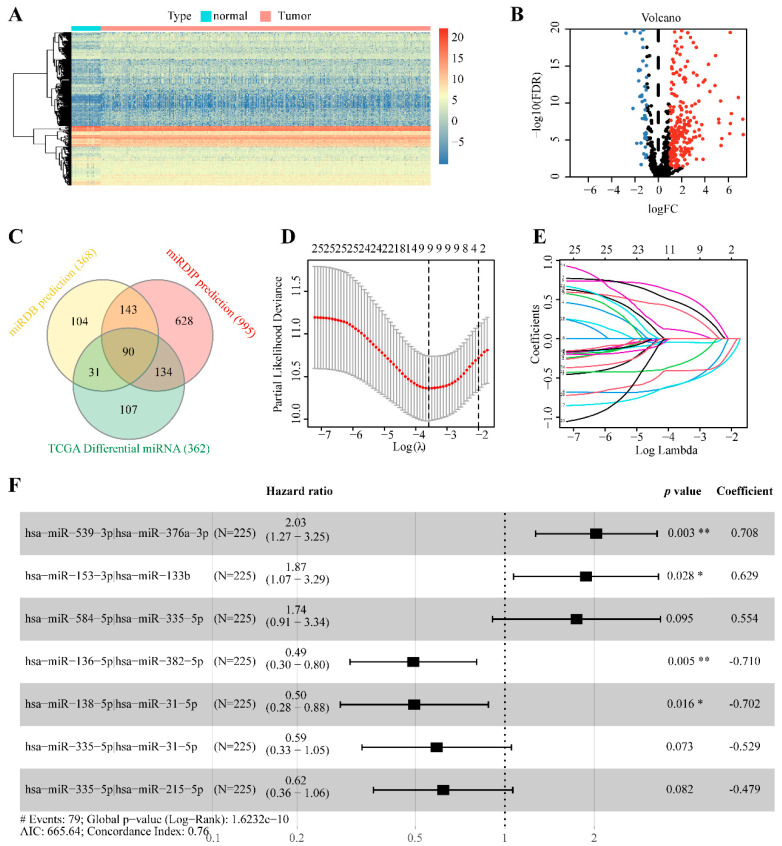
Figure 2.
Construction of a prognostic model using cmiRNA Pairs. (A) Visualization of miRNA expression and (B) differentially expressed miRNA between tumor and normal tissues (red and blue dots indicate up-regulated and down-regulated miRNAs, respectively). (C) Venn diagram showing the number of differentially expressed circadian miRNAs (DEcmiRNAs). (D,E) Filtration of the DEcmiRNAs pairs using LASSO regression analysis (each differently colored line represents a candidate variable in the LASSO regression analysis). (F) The forest map showed the seven cmiRNA pairs of the established prognostic signature. (* p < 0.05; ** p < 0.01).

