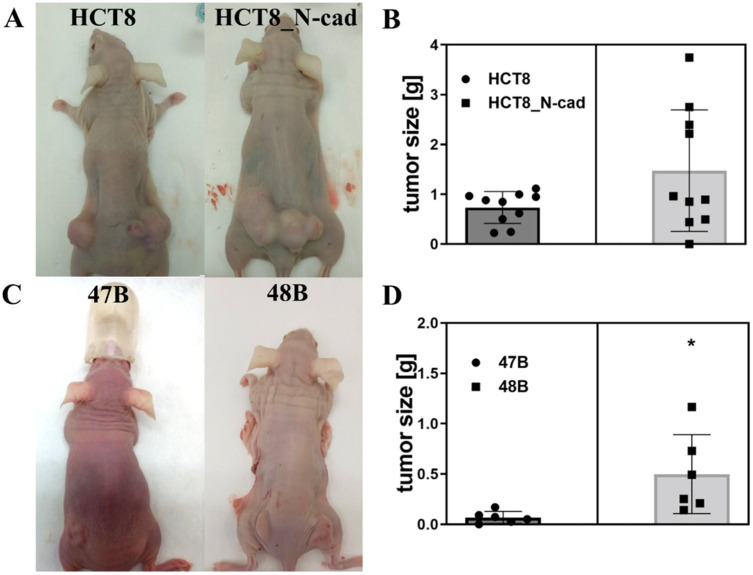
Figure 3.
Comparison of tumor growth in Foxn1-nu mice after implantation of colon cancer cell lines and derived primocultures with different levels of N-cadherin. (A) mice, 21 days after implantation of HCT8, resp. its N-cadherin plasmid-treated variant; (B) comparison of tumor size 21 days after implantation of HCT8, resp. its N-cadherin plasmid-treated variant (n = 10/set); (C) mice, 40 days after implantation of derived colon cancer primoculture cells 47B and 48B; (D) comparison of tumor size, 40 days after implantation of derived colon cancer primoculturec cells 47B and 48B (n = 6/set). The data present means of ten tumor weight obtained from five mice per tested group in HCT8, resp. six tumor weight obtained from three mice per tested group in 47B or 48B, and their 95% confidence interval values are shown as mean ± SD. * p < 0.05 48B vs. 47B tumor size.

