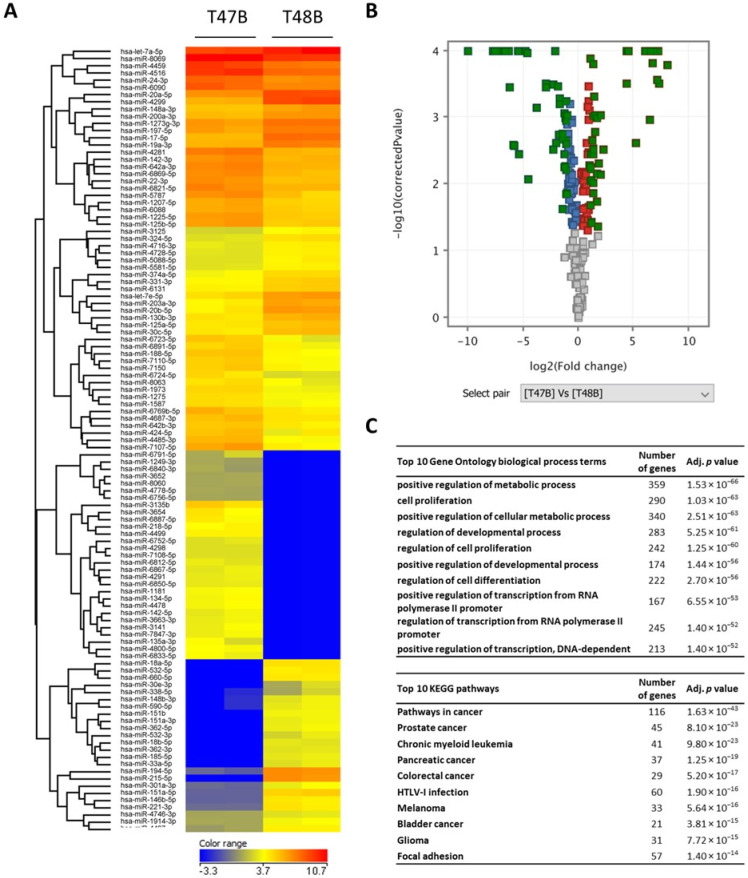
Figure 6.
Heatmap with the unsupervised hierarchical clustering of differentially expressed miRNAs between mice-implanted cells of 47B and 48B colon cancer primocultures ((A), volcano plot of miRNA array results (differentially expressed miRNAs are green colored) (B), and top 10 significant Gene Ontology (GO) biological process terms and KEGG pathways (C).

