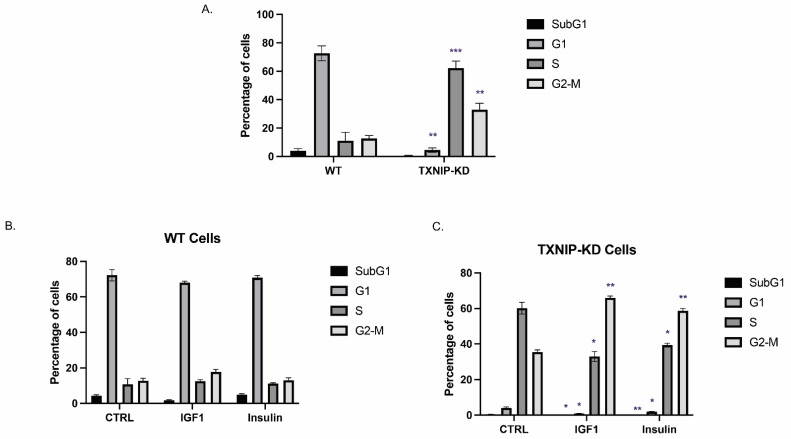
Figure 2.
Effect of TXNIP on cell cycle distribution. (A) TXNIP-KD and wild-type HEK293t cells were starved for 24 h, after which they were subjected to cell cycle analysis using flow cytometry. Quantitative analysis of the proportion of the cells in each phase was performed from at least 10,000 cells per sample. (B,C) Wild-type (B) and TXNIP-KD HEK293t (C) cells were starved for 24 h, after which they were treated with IGF1 or insulin for an additional 24 h. Flow cytometry analysis of cell cycle shift by hormone treatment was then performed. * p-value ≤ 0.05; ** p-value ≤ 0.01; *** p-value ≤ 0.001.

