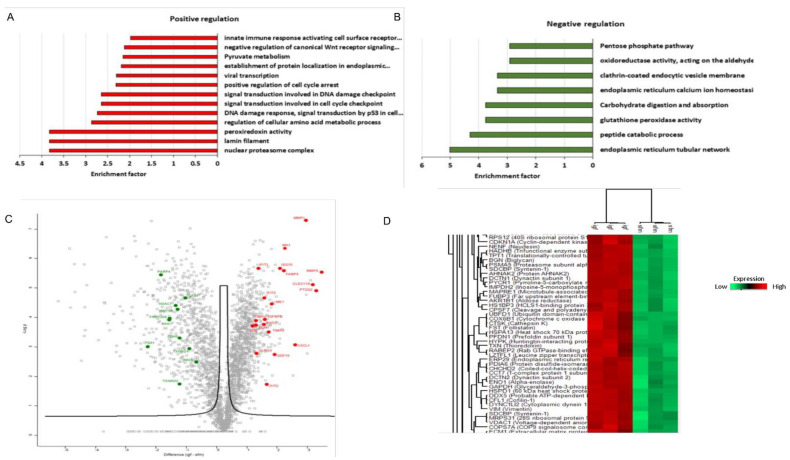
Figure 6.
Signature of core senescence proteins, networks and pathways in prolonged IGF1-induced senescence. Summary of proteins significantly altered (p-value < 0.05) by prolonged IGF1 treatment compared to serum starvation condition in human skin primary fibroblasts. Analyses were performed with the Perseus tool using proteins with FDR-corrected p-value less than 0.05 and log2 fold-changes greater than 1.5. (A,B) Gene Ontology enrichment analysis of differentially expressed proteins in prolonged IGF1-treated cells. Proteins were ranked by average log2 fold-change and analyzed by gene set enrichment analysis (GSEA). Normalized enrichment score was calculated for upregulated and downregulated pathways resulting from prolonged IGF1 treatment. (C) Volcano plot representing average log2 (prolonged IGF1 treatment—serum starvation) fold-change in X-axis versus –log10 p-value in Y-axis, combined statistical significance from three datasets. Red and green dots denote proteins that were consistently up- or downregulated, respectively, in all three datasets (FDR-corrected p-value < 0.05, average absolute log2 fold-change > 1.5). (D) Hierarchical clustering representing a part of the cluster containing differentially expressed proteins with the smallest FDR-corrected p-value after integrating the three datasets. All independent technical replicates are shown. Note that the fold-changes presented in the figure are in logarithmic terms (log2). Log2 fold-change of 1.5 is equal to fold-change of 2 or (1.5)2.

