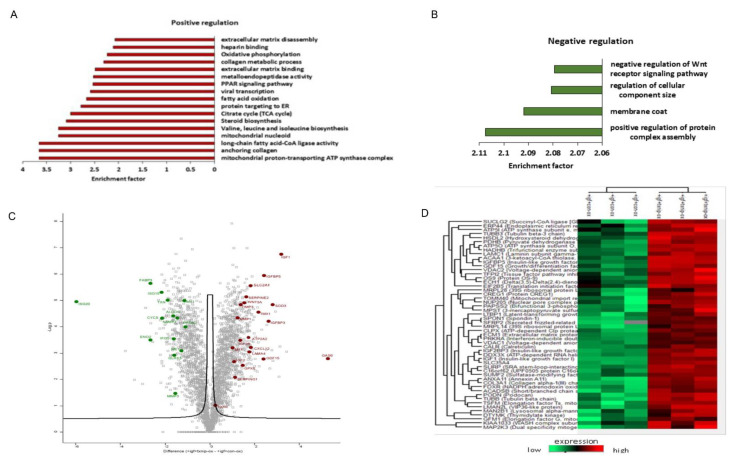
Figure 7.
Signature of a unique senescence network and pathways upon TXNIP induction in prolonged IGF1-induced premature senescence. Summary of proteins significantly altered (p-value < 0.05) by TXNIP induction compared to empty vector-transfected in prolonged IGF1-treated human skin primary fibroblasts. Analyses were performed with the Perseus tool using proteins with FDR-corrected p-values less than 0.05 and log2 fold-changes greater than 1.5. (A,B) Gene Ontology enrichment analysis of upregulated (A) and downregulated (B) proteins in TXNIP-transfected prolonged IGF1-induced senescence. Proteins were ranked by average log2 fold-change and analyzed by GSEA, normalized enrichment score (NES) was calculated. (C) Volcano plot representing average log2 (TXNIP+IGF1—Empty vector+IGF1) fold-change in X-axis versus –log10 p-value in Y-axis, combined statistical significance from three datasets. Red and green dots denote proteins that were consistently up- or downregulated in all three datasets (FDR-corrected p-value < 0.05, average absolute log2 fold-change > 1.5). (D) Hierarchical clustering representing a part of cluster containing differentially expressed proteins with the smallest FDR-corrected p-value after integrating the three datasets. All independent technical replicates are shown. Note that the fold-change represented in the figure are in logarithmic terms (log2). Log2 fold-change of 1.5 is equal to fold-change of 2 or (1.5)2.

