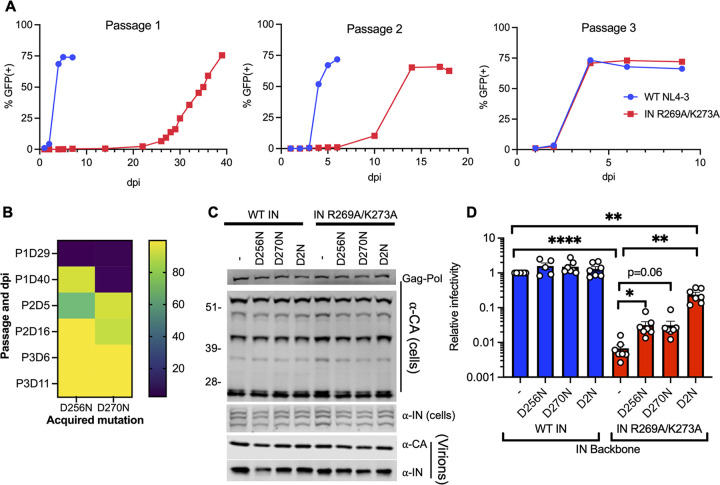
FIG 1.
D256N and D270N compensatory substitutions in HIV-1 IN suppress the replication defect of the HIV-1NL4-3 IN (R269A/K273A) class II mutant virus. (A) MT4-LTR-GFP indicator cells were infected with HIV-1NL4-3 at an MOI of 2 i.u./cell or an equivalent particle number of the HIV-1NL4-3 IN (R269A/K273A) class II IN mutant virus (based on reverse transcriptase [RT] activity) as detailed in Materials and Methods. HIV-1NL4-3 IN (R269A/K273A) viruses were serially passaged for three rounds until the emergence of compensatory mutations that allowed virus replication with WT kinetics. The graphs represent the percentage of GFP positive cells as assessed by flow cytometry over three passages at the indicated days postinfection (dpi). (B) HIV-1 genomic RNA was isolated from viruses collected from cell culture supernatants over the three passages (i.e., P1, P2, P3) and at the indicated days postinfection (i.e., D29, D40, etc.) as described in Materials and Methods. Heatmap shows the percentage of IN D256N and D270N substitutions at the indicated passages and days postinfection (dpi) as assessed by whole-genome deep sequencing. (C) HEK293T cells were transfected with full-length pNL4-3 expression plasmids carrying pol mutations coding for the IN D256N, D270N, and D256N/D270N (D2N) substitutions introduced on the WT IN and IN R269A/K273A backbones. Cell lysates and cell culture supernatants containing virions were collected 2 days posttransfection and analyzed by immunoblotting for CA and IN. The image is representative of five independent experiments. See Fig. S1 for quantitative analysis of immunoblots. (D) HEK293T cells were transfected as in panel C, and cell culture supernatants containing viruses were titered on TZM-bl indicator cells, whereby virus replication was limited to a single cycle by addition of dextran sulfate (50 μg/mL). The titers were normalized relative to particle numbers as assessed by an RT activity assay and are presented relative to WT (set to 1). Also see Fig. S1 for titer and RT activity values prior to normalization. The columns represent the average of 5–6 independent biological replicates, and the error bars represent standard error of the mean (SEM) (****, P < 0.0001; **, P < 0.01; *, P < 0.05, by one-way ANOVA multiple comparison test with Dunnett’s correction).

