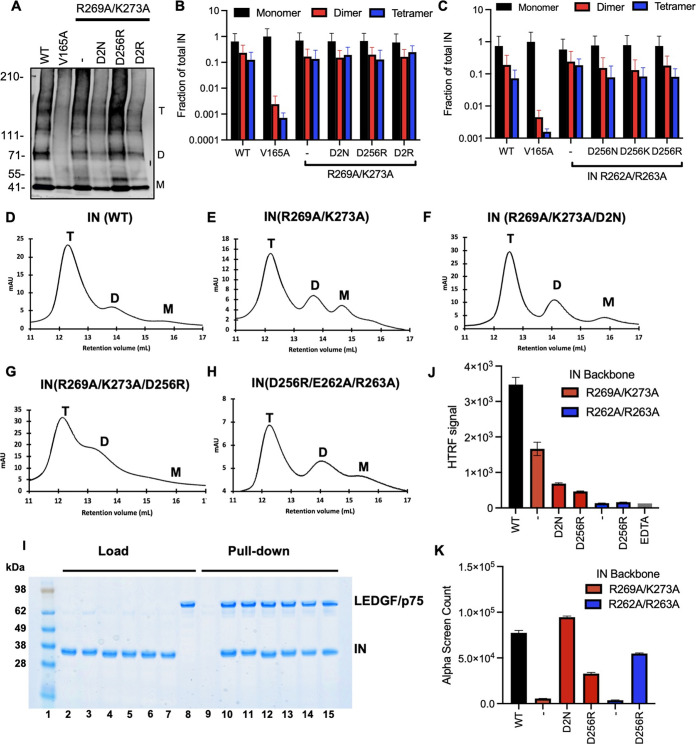
FIG 6.
Assessing multimerization properties of IN in mutant viruses. (A) Purified WT or IN mutant HIV-1NL4-3 virions were treated with 1 mM EGS, and virus lysates analyzed by immunoblotting using antibodies against IN following separation on 3–6% Tris-acetate gels as detailed in Materials and Methods. The position of monomers (M), dimers (D), and tetramers (T) are indicated by arrows in a representative Western blot. (B, C) Quantification of IN multimerization in virions from experiments conducted as in A. Error bars show the SEM from three independent experiments. (D–H) Representative SEC traces for indicated recombinant IN proteins at 20 μM. The x axis indicates elution volume (mL) and y axis indicates the intensity of absorbance (mAU). Tetramers (T), dimers (D), and monomers (M) are indicated. Representative chromatograms from two independent analyses are shown. (I) Affinity-pulldown assays showing binding of WT and mutant INs to LEDGF/p75. Lane 1: molecular weight marker; Lanes 2–8: loads of 6xHis-tagged WT IN, IN(R269A/K273A), IN(R269A/K273A/D256N/D270N), IN(R269A/K273A/D256R), IN(D256R/R262A/R263A), IN(D256R/R262A/R263A), and FLAG-tagged LEDGF/p75; Lanes 9–15: affinity pull-down using Ni beads of LEDGF/p75 with buffer only (control), 6xHis-tagged WT IN, IN(R269A/K273A), IN(R269A/K273A/D256N/D270N), IN(R269A/K273A/D256R), IN(D256R/R262A/R263A), and IN(D256R/R262A/R263A). (J) Catalytic activities of mutant IN molecules in the presence of LEDGF/p75 monitored by HTRF based assay. The bars represent the ratio of emission signal at 665 nm over that of 615 nm, which was then multiplied by a factor of 10,000. The error bars indicate the standard error of the mean from triplicate experiments. (K) Summary of mutant INs bridging TAR RNA compared to WT IN. Alpha screen counts at 320 nM for each protein is shown. The graphs show average values of three independent experiments, and the error bars indicate standard deviation.

